Production Timesheet
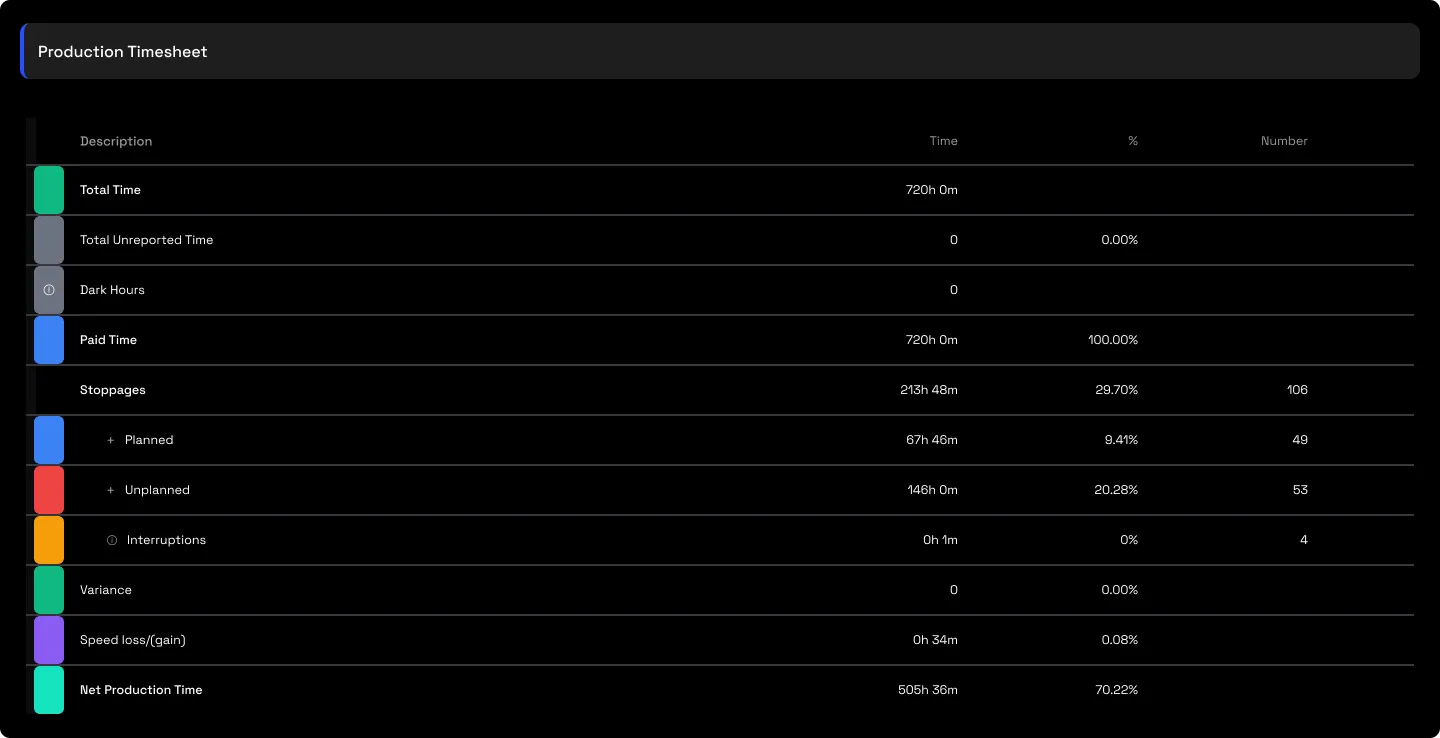
The time-accounted production log: a full Availability × Performance × Quality breakdown for the period, reconciled to the Augos waterfall. It's the bridge between the OEE view and the phase view.
1 · The purpose of this report
It gives managers the classic OEE decomposition they benchmark against world-class, grounded in the same loss account as everything else, and it's the standard cross-check that the Traditional and Augos bottom lines agree, which they do by construction.
2 · On the page
Top to bottom: the controls, then the period summary, then the interval log.
2.1 · Selectors
| Control | What it does |
|---|---|
| Point selector | Choose the site or line whose OEE you want. |
| Date selector | Set the period the A×P×Q is calculated over. |
2.2 · The A×P×Q summary
Availability, Performance and Quality, and the OEE they multiply to, shown alongside the Augos loss buckets: the planned split, unplanned stops, interruptions, the net speed and quality effects, and Net Production Time. The two bottom lines, OEE and Net Production Time, are built independently and land on the same number, which is the whole point of the page.
Reading the three factors is itself a router, a low one tells you which report to open next:
| Factor | Reads low when… | Where to go next |
|---|---|---|
| Availability | The line stops too much. | Downtime & the stoppage analyses |
| Performance | It runs below its ideal rate. | Speed and interruptions |
| Quality | Too many rejects and rework. | Investigate rejects / variance |

2.3 · The interval table
The per-interval production entries: the timesheet proper, a detailed log of what ran when.
3 · Use cases
- Find the real lever. A line can run fast and clean yet post a low OEE because it simply isn't available enough, the factors show that at a glance, so you fix uptime rather than chasing speed you already have.
- Speak the familiar language. Give a customer "their OEE number" in the A×P×Q terms they already benchmark against, reconciled to a second, independent methodology and down to time-stamped events.
4 · Good to know
Every OEE consultant produces an A×P×Q; this one reconciles to a time waterfall and down to time-stamped events, and the two bottom lines agree to within rounding. One honest caveat: the way the planned loss is split into planning efficiency and operator discipline currently differs between this report and Performance Overview, the totals match, the internal split doesn't, so quote the Performance Overview split until that reconciliation lands.
5 · Common questions
OEE here versus Net Production Time elsewhere, which is right?
Both. They're built to agree, and they do, to within rounding. If you ever see a real gap, it's a window or mode mismatch, not two different truths.
World-class OEE is 85%, we're well below.
Read the factors. If Performance and Quality are above 90%, the whole gap is Availability: a stoppage problem with named reasons in the downtime and stoppage reports, not a "run faster" one.