Downtime Report
The event-level ledger of every stoppage, and the reason tree behind it. This is the raw layer beneath availability & downtime that every other report aggregates from, the audit trail that makes every number defensible.
1 · The purpose of this report
When a manager questions a number on any higher report, this is where you go: the individual stops behind it, each with its reason path, operator, duration and planned/unplanned tag. Its roll-up carries the same phase totals the upper reports use, so counts and times reconcile verbatim.
2 · On the page
The report is deliberately raw: under the module's usual point selector and date controls sit three linked views of the same stops.
2.1 · Selectors
| Control | What it does |
|---|---|
| Point selector | Choose the site or line whose stops you want to inspect. |
| Date selector | Set the period. To reconcile against a stoppage analysis, read this in all-stops terms and match its point and window. |
2.2 · The event list
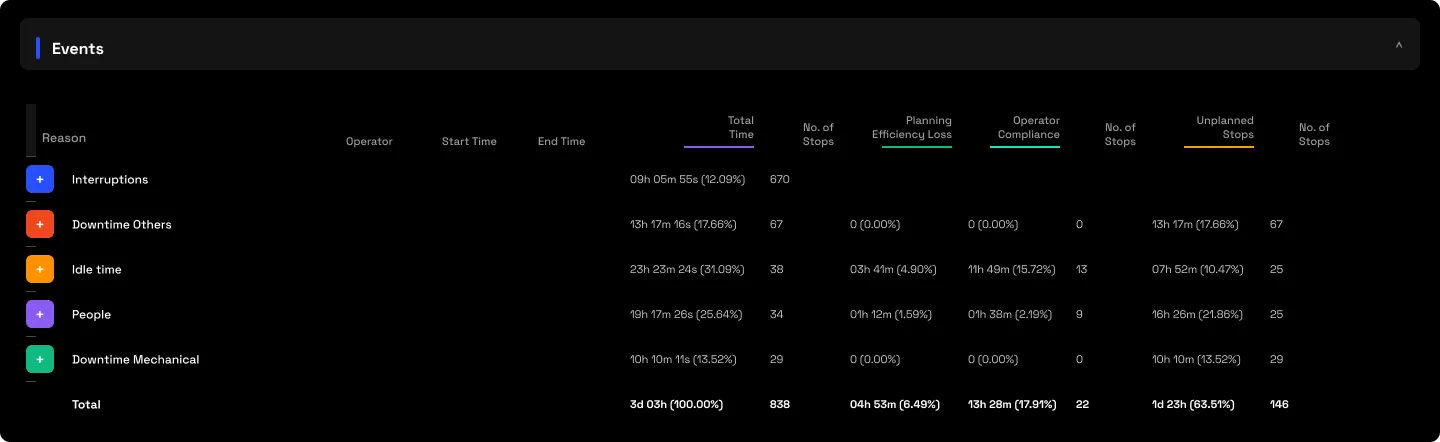
Every individual stop, in order: start and end, duration, the full reason path, the operator, and whether it was planned or unplanned. This is the atomic record; every aggregate in the module sums back to it.
2.3 · The reason tree
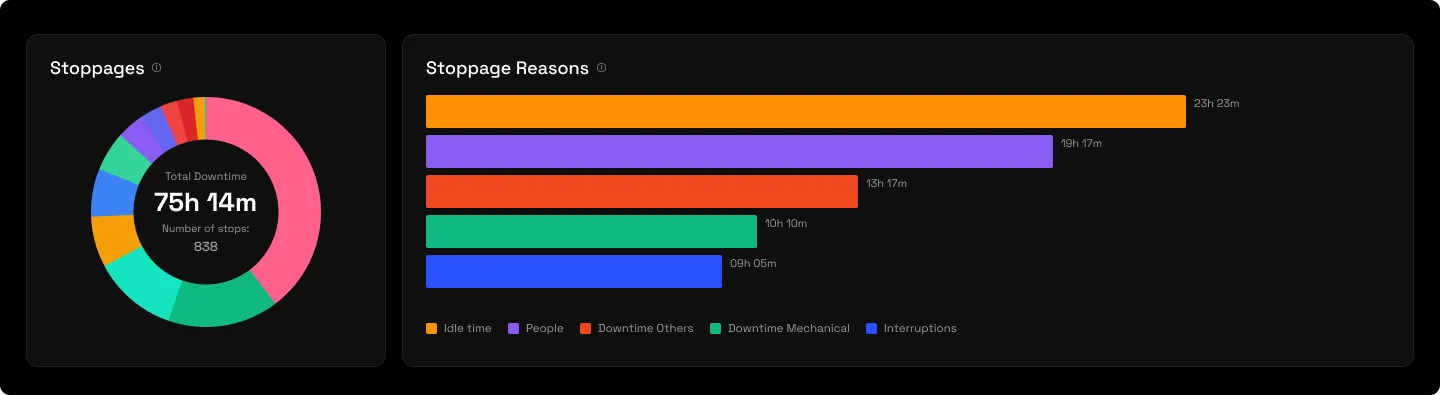
The same hierarchy the Executive Summary's Stoppage Reasons chart renders and the two stoppage analyses drill, each node carrying its stop count, total time and share of the whole. A branch like Downtime Mechanical → Sealing and Closing → a specific station fault is where maintenance finds a target.
2.4 · The summary
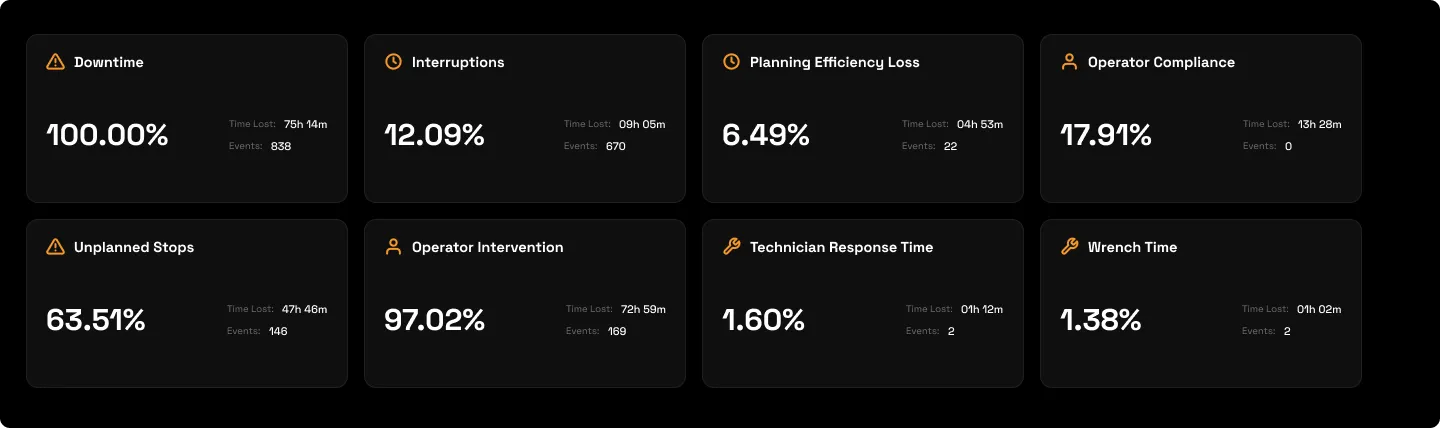
The roll-up: total, planned and unplanned counts and times, plus the phase decomposition (planning efficiency, operator compliance, operator resolution, technician response and wrench). "Operator Compliance" here is the same quantity Performance Overview calls Operator Discipline, one label difference, same number.
3 · Use cases
- Settle a dispute. The first stop for any "this number looks wrong" question, the individual stops behind the headline, timestamped and operator-attributed for inspection.
- Target a failure mode. Maintenance can rank the specific faults driving the Pareto, the reason tree names and counts them, so the biggest recurring failure is obvious.
- Reconcile an export. Pulled in all-stops mode, it's the ground truth to check any other report or downstream system against.
4 · Good to know
When comparing with the stoppage reports, make sure the same outlier settings are applied, otherwise the totals may not match. This report is deliberately raw; for benchmarks, scoring and recoverable-time pricing, move up to the stoppage analyses. "Dark hours" can appear here: it's time outside paid production, when no shift or run is scheduled, not downtime to classify.
5 · Common questions
Totals don't match the Stoppage Analysis.
Check the stoppage report is in All-Stops mode, on the same point and period, its on-screen default is non-outlier, which reads smaller. In the same mode they reconcile exactly.
What is "Operator Compliance" here?
The same quantity Performance Overview calls Operator Discipline, the time variance from the allocated plan. It's a naming drift between reports, not a different measure.