Standard OEE shows the loss. OEE+ shows who owns it.
We keep Availability, Performance and Quality as you know them, then give every lost minute an owner.
- Planned time, 440 minchangeovers excludedPaid time, 480 minevery minute the crew was paid for−6.7
- Rated speed 720/hdrifted over the yearsDesign speed 840/hwhat the line was bought to do−10.5
- 48 short stops inside "performance"never written down46 min, each with an ownermoves the owner, not the number±0
A real 63 you can raise beats an 80 you can't.










What one line showed in seven days.
One anonymised production line, one week in 2026: 3,334 stops and 38.6 hours lost. Engineers have two reactions to a first week of data. Both are useful.
"I knew it." The station everyone already blamed.
One recurring fault at that station accounted for 18 stops and 2.6 hours. The engineers were right. They had never had the number, and the number put it first on the list.
"I didn't know that." The stops nobody writes down.
Together they cost 38% of everything the line lost, more than every mechanical fault combined. Nobody logs a 17-second stop. One sensor logs all of them.
"That's not a fault." The gap between shifts.
No reason code had ever captured it, because it isn't a breakdown. It is paid time with no owner, until the Owner column gave it one: planning.
Augos platform, Downtime Report · one anonymised production line · one week in 2026 · site, products and people removed
Every paid minute gets an owner.
The Owner column attributes each lost minute to the function that can recover it, so the grey areas get a name.
- Six owners: operator, technician, planning, quality, external and shared.
- Plan against standard: overrun is the Operator Compliance loss. Slack in the plan is Planning Efficiency Loss.
- Your own best shift: the target is the Best Operator Benchmark, built from your floor, not a textbook 85%.
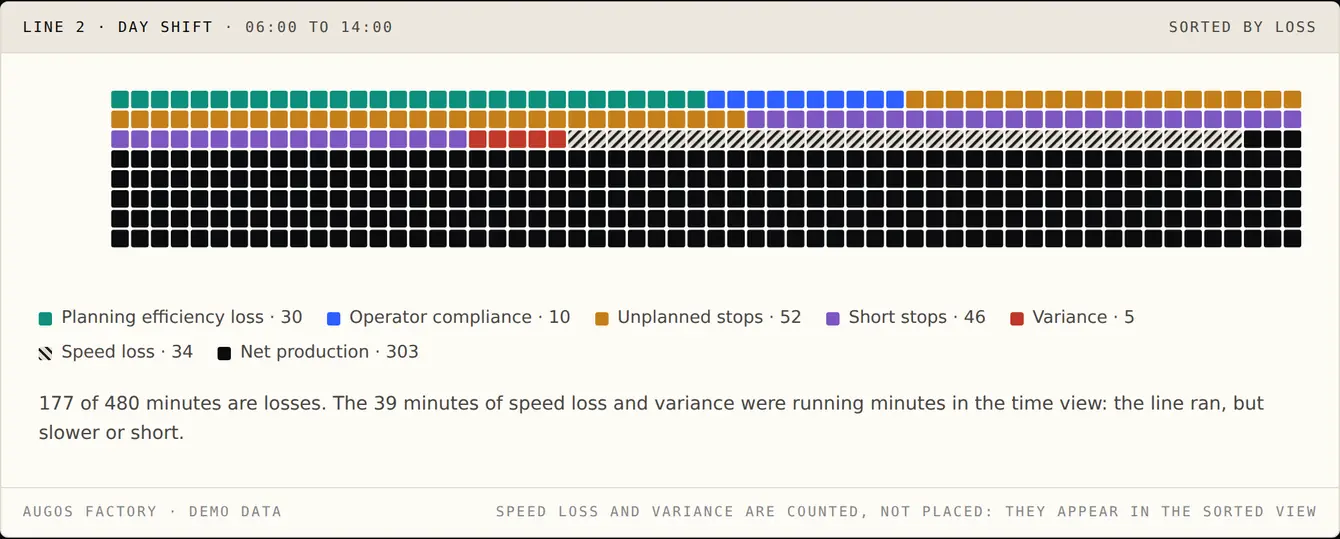
One sensor sees every stop. The operator says why.
The sensor counts the line. The operator records the reason on a simple drill-down, including the ones no sensor can see: a forklift, a pallet shortage, a shared compressor.
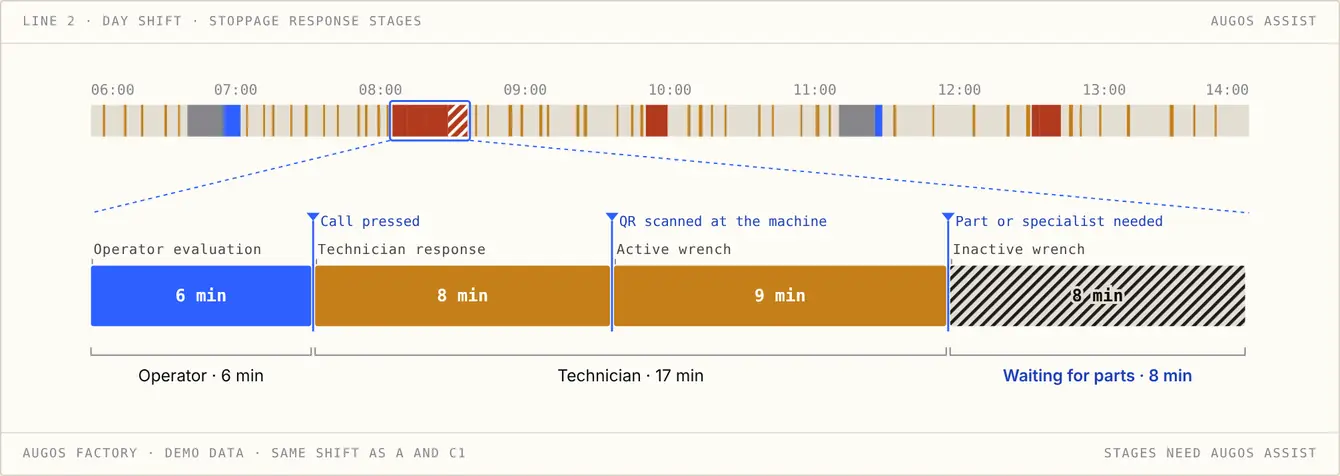
Augos Assist splits each unplanned stop into operator evaluation and resolution, technician response time, and active and inactive wrench time. It makes accountability clear, closes the response gap, removes friction between operator and technician, and shortens the time to evaluate and respond. Without Assist, an unplanned stop is one number, still analysed by event, operator and product.
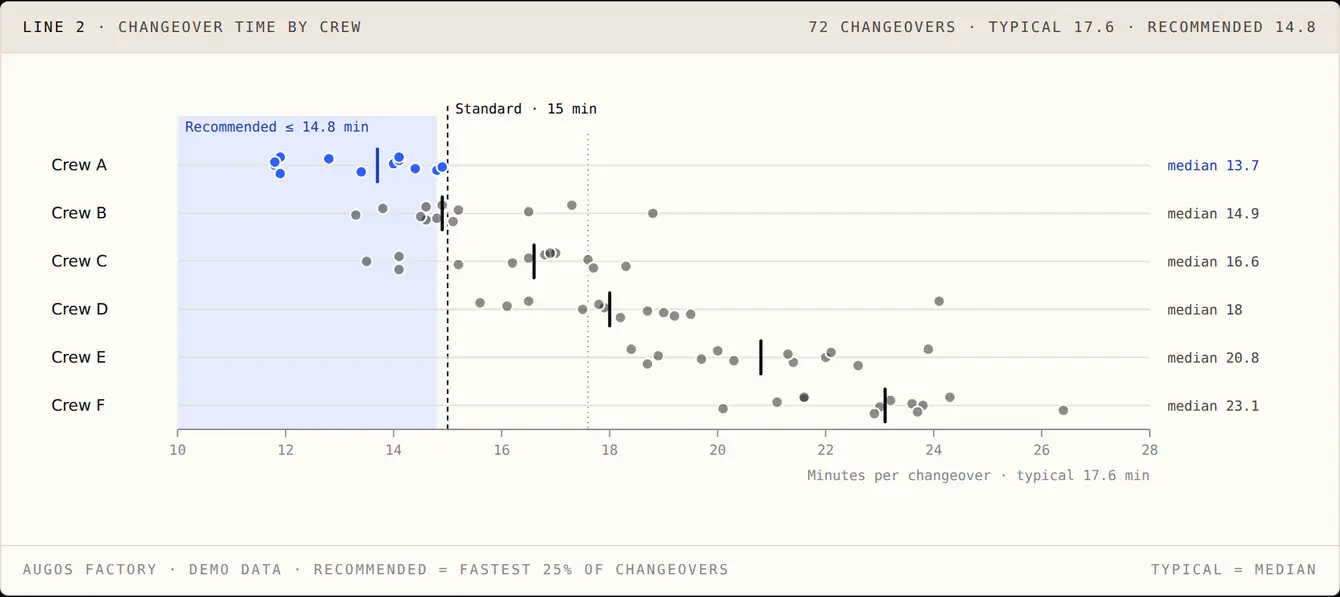
Your best crew already beats the standard.
Same machine, same product, different crews. Make your best crew's time everyone's target before you ask for capital.
Live within 48 hours. No project.
Before we arrive
Three templates: your products and rated speeds, your stoppage reasons, your operators. Photos of the line are enough for a remote assessment.
Power and mount
You provide a power point at the line. Augos supplies the SIM, so there is no network project. Your own people mount and connect the terminal with our guidance, and the sensor goes on the bottleneck.
Two days with your team
Operators practise logging stops, managers learn the reports, and most are independent after one or two shifts. Four weekly one-hour data reviews follow, and your leadership is trained on the platform.
Nothing to maintain
Products, reasons and firmware all arrive over the air. Support is remote and continuous.
What it costs, and what you get.
One offer covers every line. The monthly fee includes every capability except the metrics that need Augos Assist, an optional extra.
R19,500 once per line for deployment, ex VAT.
Several lines? The price per line falls. We agree it with you in conversation.
Book a demoThe first 90 days cannot be cancelled. After that, one calendar month's notice, and the hardware comes back to Augos.
The monthly fee includes
- Every capability, except the metrics that need Augos Assist
- The Augos Operator Terminal and pulse sensor, owned by Augos
- A SIM supplied by Augos, so there is no network or IT project
- A free terminal replacement every 36 months, and a one-year warranty
The once-off fee covers
- Set-up and remote testing
- Two days of on-site operator training
- Four weekly one-hour data reviews
- Leadership training on the platform
Travel and subsistence for on-site training are not included.
What you provide
A power point at the line. Your own people mount and connect the terminal, with our guidance.
Optional extras, per month, ex VAT
- Augos Assist: R250 per technician, or R1,250 for the whole site
- Public Display: R300 per display, or R1,500 for the whole site
Common questions.
Isn't this just OEE?
The maths is the same. Availability, Performance and Quality are kept exactly as you know them. What Augos adds is an owner on every lost minute and a breakdown of every stop into its stages, which is the part a standard OEE report skips.
How quickly can we be measuring?
Within 48 hours of your kit arriving: fill in one worksheet, give us a 220 V point by the bottleneck, mount the sensor, and we switch it on over the air. 4G is built into the terminal and Augos supplies the data SIM, so it stays off your plant network. Because the rules arrive over the air, installation starts before your products, stoppage reasons and operators are finalised.
Do you integrate with our PLC, ERP or MES?
Nothing is wired into your PLC or MES: one pulse sensor counts the line and the Augos Operator Terminal does the rest on board. ERP integration is available through the Augos APIs, for jobs and products. Your data also exports as CSV, Excel or the signed AI Bridge payload.
How can one sensor see every reason for a stop?
The sensor sees that the line stopped. The operator records why, on a simple drill-down at the terminal, including the reasons no sensor could detect: waiting for a forklift, a pallet shortage, a shared compressor down.
Will operators feel watched?
Operators are judged on the median, so one bad day defines nobody, and against your own line's best shift rather than a textbook figure. Peer data is masked. Measure people clumsily and they work around it; this is built to be fair so they don't.
How do you charge?
R19,500 once per line for deployment, plus R4,950 per line per month, ex VAT. There are no tiers. The monthly fee includes every capability except the metrics that need Augos Assist, an optional extra at R250 per technician per month or R1,250 per month for the whole site. Augos owns the hardware. The first 90 days cannot be cancelled; after that it is one calendar month's notice.
What does the deployment fee cover?
Set-up and remote testing, two days of on-site operator training, four weekly one-hour data reviews and leadership training on the platform. Travel and subsistence for on-site training are not included.
See where one line's hours go, and who can get them back.
A 30-minute call with a manufacturing specialist. We look at one of your lines together and show you what the first week of data would say about it.
- Live within 48 hours of your kit arriving
- One sensor, one terminal, no PLC and nothing to integrate
- R4,950 per line per month, ex VAT. 90 days, then a month's notice