Augos Factory / How it works / The method
The method, for analytical buyers
Recoverable hours, measured against your line's own best.
No textbook 85%. Each stop reason is compared with its own recommended time on your line: a fast pace it already reaches regularly. The gap, counted in hours, is what your plant has already shown it can win back. Here are the formulas, a worked example and the limits.
In short
Recoverable time is the time each stop ran beyond its target, summed. The target is the recommended time: the median less the median absolute deviation of the reason's events this calendar year to date, outliers removed. To estimate a rand figure yourself, multiply by what an hour of net production earns your line. The platform shows lost time in hours. It measures paid time the plant has already shown it can recover, not a forecast saving. In the knowledge base the method is OEE+: standard OEE with an owner on every lost minute. What it costs ›
The three numbers
Typical, target, gap
Every stop reason on every line gets three numbers, worked out from this calendar year's events so far. The target comes from the line's own record, so it moves both ways as stops come in: faster runs pull it down, slower runs push it up. When the line's best beats a standard, the plant decides whether to tighten it. When the target sits above a standard, the standard may be too tight for the line, and the plant can review it.
Typical time
Target
Recoverable hours
your own estimate in rand = recoverable hours × rand value of an hour of net production (good units × sales value ÷ net production hours)
Planned stops
Standard plus overrun
Changeovers, cleaning and breaks follow one rule. Actual time is the allowed time plus the overrun, and the stop stays a planned stop however long it runs. The allowed time is planning's, shown on screen as Planning Efficiency Loss. The overrun is the line team's, shown as Operator Compliance. The line's own best is the benchmark: where it beats the standard, the standard can be tightened.
One changeover, split two ways
IllustrativeIllustrative stop, not a customer.
Who the time sits with
Every lost hour goes to the person who can win it back
Who owns a lost minute depends on the part of the stop it falls in, not on the stop reason. Nothing is set per reason in your workbook. The knowledge base sets out the rule in OEE+ and the Owner column. A department is the roll-up of the people measured: operators to production, technicians to the technical team. The root of a stop is found in the reason tree, from the reason to the machine, assembly, component and part, down to the event log.
| Part of the stop | Who it sits with | Why |
|---|---|---|
| Planned stop: the time allowed | Planning | The plant set the standard. A bucket, not a person: there is no planning module |
| Planned stop: the overrun (Operator Compliance) | The operator logged in | Execution against the standard |
| Unplanned stop: evaluation and resolution | The operator logged in | From the stop until the call, and clearing it alone. A wait for material with no call sits here, with its root in the reason tree |
| Unplanned stop: response, active wrench, inactive wrench | The technician who accepted the call | Needs Augos Assist. Without it the whole stop sits with the operator |
| Interruptions (short stops) | Their own account, traced to the operator and product | Counted by the sensor below the threshold; no reason, no call |
| Speed loss and quality loss | Reported by job and product | Against the rated speed and the good count |
Valuing an hour
We count the hours. Your finance team sets the value.
Your finance team gives each product a sales value, the rand value of one good unit. The dashboards show net production time in rand: the good units made, times their sales value.
- An hour of net production is worth what the line actually made in it. Faster runs make the hour worth more, slower runs less.
- The value comes from the products that ran in the period. There is no averaging.
- Losses are shown in hours and as a share of paid time, not in rand.
- Finance can change a sales value later, with approval. Past figures are then recalculated.
- No "acceptable downtime" allowance: targets come from your line's own best.
The method in the platform
Every recoverable hour, ranked in one report
Performance Overview applies the method to the whole line. Each loss shows its current time and its Potential Gain against the line's own best, so the biggest lever is first.
1
Find the biggest band
The time account sums to 100% of paid time. Rank the KPIs by Potential Gain: the largest is where to start.
2
Open its top five
Every KPI opens the stop reasons and the people behind it, largest first, with the share the top five explain.
3
See the full record
Open one reason for its stop history, month by month, then filter by operator and product in the stoppage analysis.
One line, two months, in three steps
IllustrativeOperators
Technicians
Assist rows come from maintenance calls: who evaluated, how long the line waited for a technician, and how long the repair ran or stood still. Without Assist, that time sits in one Operator Resolution figure.
Illustrative data, not a customer. Recreated screens of the Augos platform: Performance Overview, its Top 5 detail and the Planned Stoppage Analysis. Rows marked Assist need maintenance calls.
Worked example
One stop reason, one month
Film change on a packing line
Illustrative| Step | Working | Result |
|---|---|---|
| Typical time | Median of the film changes this calendar year to date | 9.0 min |
| Target | Median less the median absolute deviation: 9.0 − 2.5, outliers removed | 6.5 min |
| Film changes this month | From the stop log; 70 ran slower than 6.5 min | 120 |
| Time above the target | Each slow change less 6.5 min, summed | 301 min |
| Recoverable hours | 301 ÷ 60 | 5.0 h |
| Your own estimate in rand | 5.0 h × R1,800, an example value of an hour of net production | R9,000 |
Illustrative stop, not a customer. R1,800 is an example value, not a benchmark. The platform shows recoverable time in hours; the rand figure is your own estimate.
On a real line
One stop reason, four months, every number
82 clean-in-place (CIP) cycles on one anonymised beverage line, four months in 2026, as the Augos platform reports them. The typical CIP takes 2 h 50 min, exactly the time allowed. The line has already finished CIP in 2 h 14 min or less. The time above that is recoverable: 51.9 h in four months.
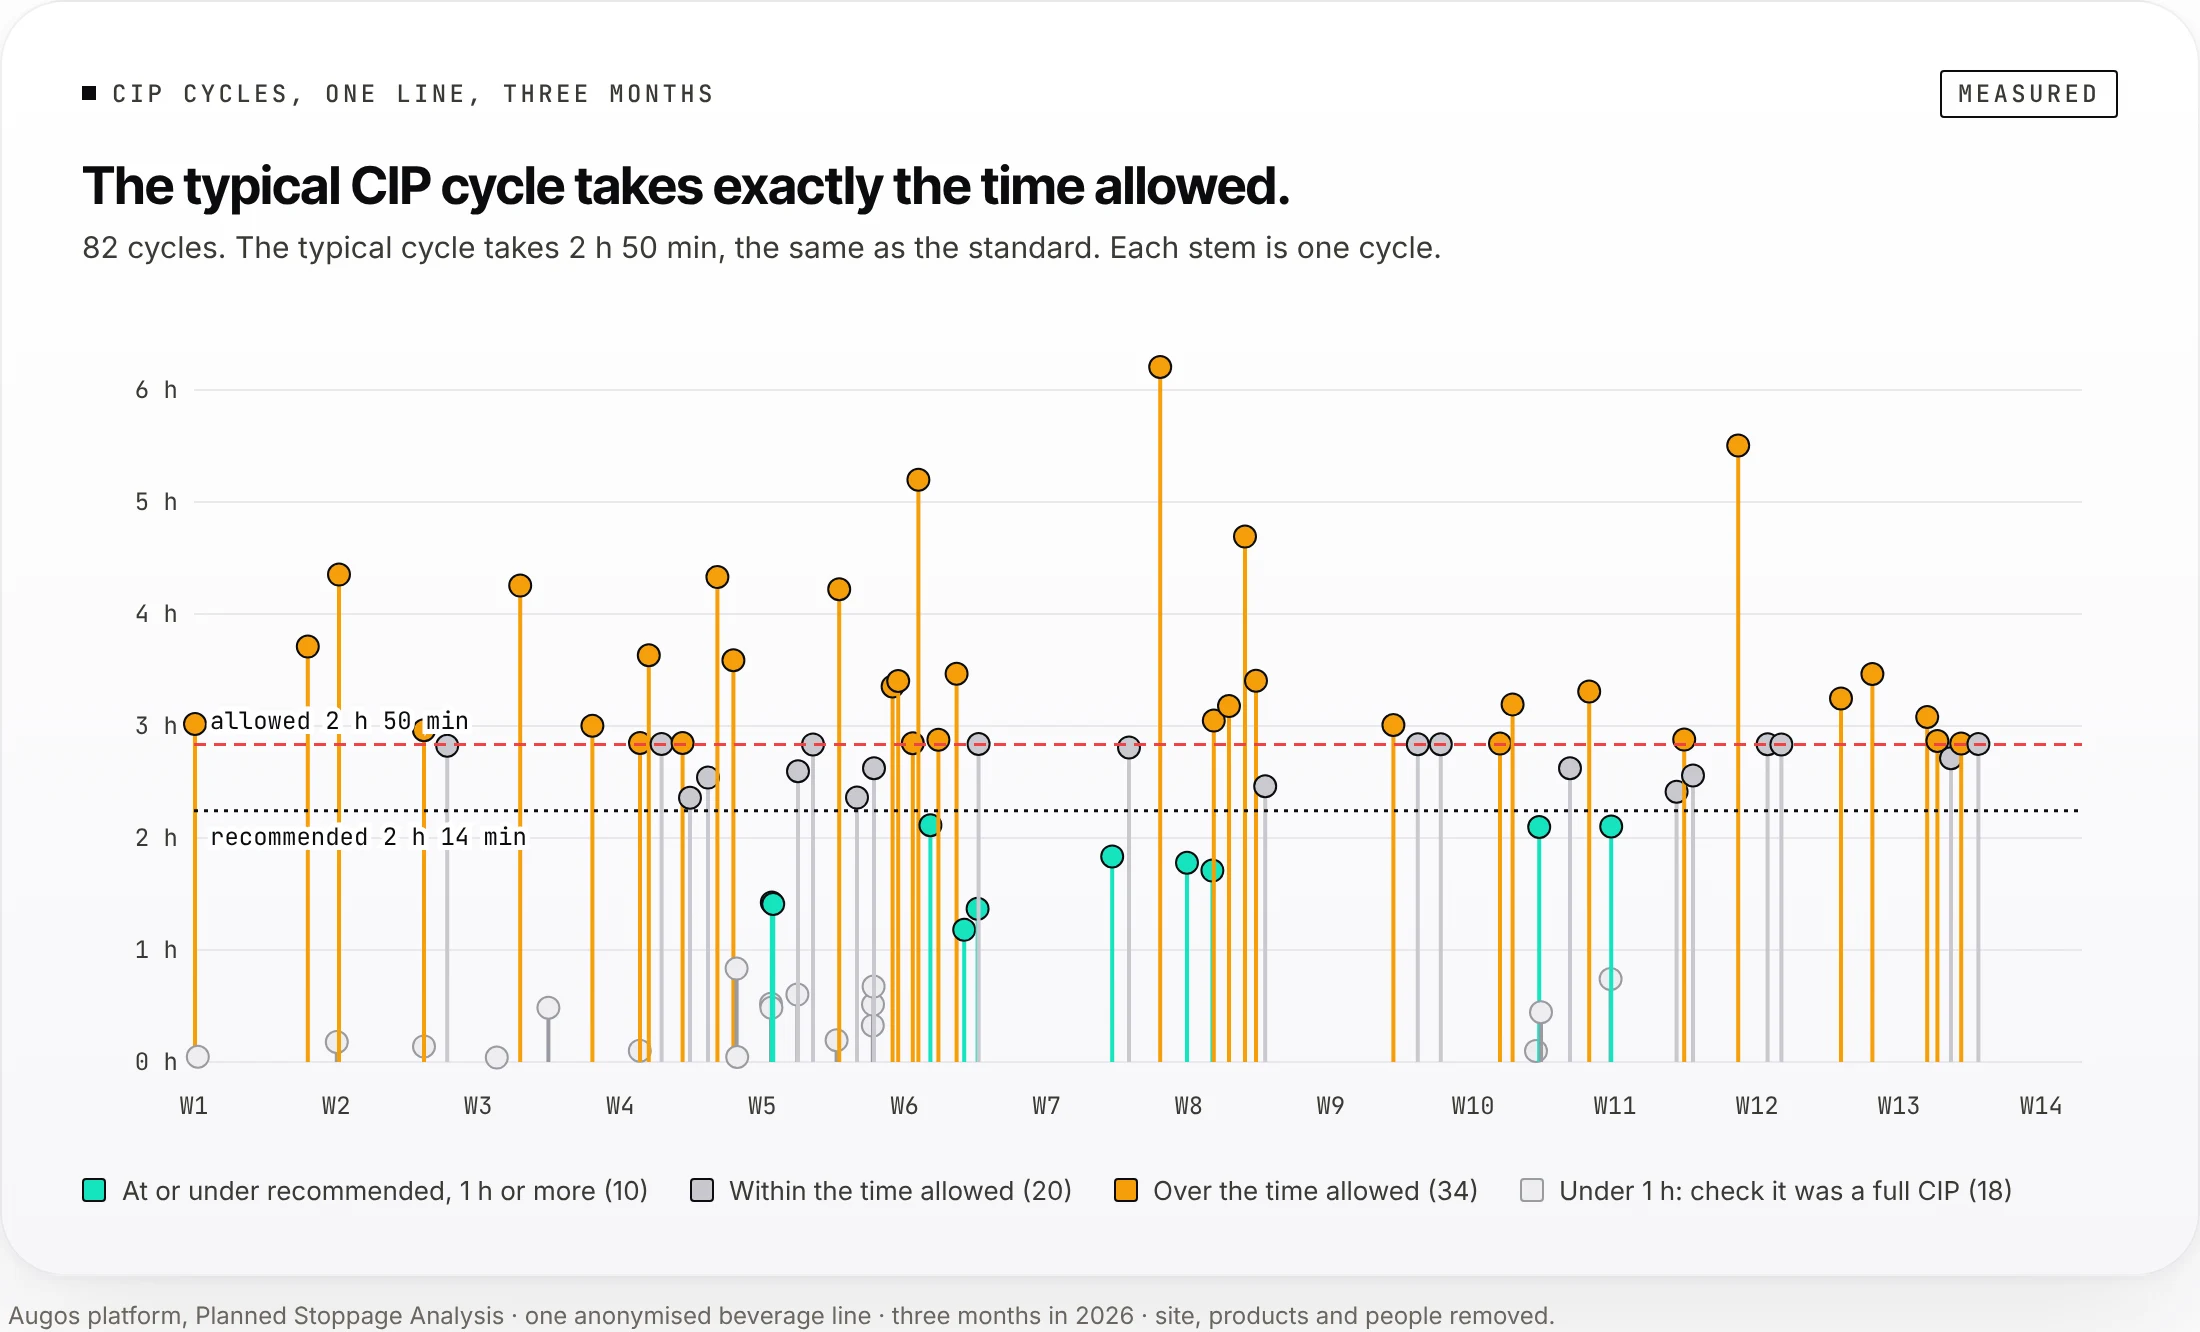
CIP, the arithmetic
Measured| Metric | How it is calculated | Four months | Month 1 | Month 2 | Month 3 | Month 4 |
|---|---|---|---|---|---|---|
| Stops | events of this reason | 82 | 10 | 40 | 24 | 8 |
| Total stop time | sum of durations | 198.8 h | 21.5 h | 86.8 h | 66.6 h | 23.9 h |
| Average stop time | total ÷ stops | 2 h 25 min | 2 h 09 min | 2 h 10 min | 2 h 46 min | 2 h 59 min |
| Share of planned downtime | CIP time ÷ planned stop time, outliers excluded | 59.1% | 58.1% | 60.7% | 61.2% | 50.3% |
| Typical stop time (stops at or under) | median duration | 2 h 50 min (50%) | 50% | 60% | 42% | 25% |
| Recommended stop time (stops at or under) | median − MAD | 2 h 14 min (33%) | 40% | 43% | 25% | 0% |
| Outlier threshold (stops above) | Q3 + 1.5 × IQR | 5 h 48 min (1%) | 0% | 3% | 0% | 0% |
| Allocated stop time | the plant's standard | 2 h 50 min | 2 h 50 min | 2 h 50 min | 2 h 50 min | 2 h 50 min |
| Time lost above allocated | Σ (duration − allocated), slower stops only | 22.6 h | 4.1 h | 9.6 h | 7.6 h | 1.3 h |
| Time gained below allocated | Σ (allocated − duration), faster stops only | 56.2 h | 10.9 h | 36.1 h | 9.0 h | 0.1 h |
| Time lost above recommended | Σ (duration − recommended), slower stops only | 51.9 h | 7.7 h | 21.5 h | 16.9 h | 5.9 h |
| Share of paid time | stop time ÷ paid time | pending | 5.4% | 11.8% | 9.3% | 6.6% |
| Improved net production time, allocated | time lost above allocated ÷ paid time | pending | 1.0% | 1.3% | 1.1% | 0.4% |
| Improved net production time, recommended | time lost above recommended ÷ paid time | pending | 1.9% | 2.9% | 2.4% | 1.6% |
Percentages are the share of stops at or under (or above) that time. Download the table (CSV) ›
This table follows the platform report: recommended time is the median minus the median absolute deviation, as in the formulas above. Four-month shares of paid time are pending a platform check.
Augos platform, Planned Stoppage Analysis · one anonymised beverage line · four months in 2026 · site, products and people removed.
The terms, in plain words
- Typical stop time
- The median duration of a stop reason: half its stops are shorter, half longer.
- Allocated stop time
- The time the plant allows for a planned stop, its own standard.
- Recommended stop time
- The median minus the median absolute deviation: a time the line has already reached on its faster stops.
- Outlier threshold
- The third quartile plus 1.5 times the interquartile range. Stops above it are one-offs, shown apart.
- Time lost above recommended
- The minutes each slower stop ran past the recommended time, added up. Faster stops count zero.
- Recoverable time
- Paid time the line has already shown it can win back: the time lost above a benchmark it has reached. Not a forecast saving.
Limits
Where the method stops short
Fewer than 10 events
No recommended time is shown. Rare stops wait until they have enough history; frequent ones qualify within days.
Changed reason codes
Splitting or renaming a reason starts its history again, so the plant keeps its list stable.
Seasons and product mix
Compare like with like: the same season, the same products. Before-and-after claims use same-season periods.
Not a saving
Recoverable hours count paid time the line has already shown it can win back. They are a target, not money in the bank.
Questions
The method, challenged
Why not benchmark against the "world-class" OEE of 85%?
85% is a generic figure from other plants, products and machines. Your line's recommended time was reached on your products, by your teams, on your equipment. So the gap is one you have already closed at least once.
Which period are the benchmarks worked out over?
This calendar year to date, from 1 January to the latest stop, outliers set aside. The figures are recalculated as stops come in and reset each January. Any week or month you report on is compared with that benchmark. The weeks before and after a change can then be set side by side.
Can the recommended time be gamed?
Durations come from sensor timestamps, which no operator can edit. Outliers are removed by a fixed statistical rule before the median is taken.
How is a lost hour valued?
Losses are shown in hours and as a share of paid time. Net production time is shown in rand: good units times their sales value. To estimate what an hour won back is worth, use what an hour of net production earns the line.
Check the method on your own data.
Bring a month of stop logs. We'll show you the typical, target and gap for your top five stop reasons.
- Your reasons, your durations
- Formulas shown, nothing hidden
- Priced on the basis your finance team picks
A manufacturing specialist replies within two business hours to set a 30-minute call.