The instantaneous dashboard.
For sensors that report a continuous value, every reading now, its trend, and how long it has spent inside the range you set.
1 · What it is for
The instantaneous dashboard is the primary view for sensors that report a continuous value, temperature, humidity, pressure, flow, irradiance and the like. As well as the live reading for each sensor, it is an exception and compliance view: it surfaces which sensors need attention, how long each has spent in and out of range, and lets you drill into any one for its full trend. It shows the period you choose, from a custom date range to a calendar month.
2 · On the page
A sensor-type toggle switches the whole view between instantaneous and state sensors, which have different data models and are shown separately. A point selector filters by group and sub-group, following the way your site is named, and a date control sets the period.
2.1 · Selectors and indicators
| Control | What it does |
|---|---|
| Sensor-type toggle | Switch the whole view between instantaneous and state sensors, which have different data models and are shown separately |
| Point selector | Filter by group and sub-group, following the way your site is named |
| Date control | Set the period: a custom date range or a calendar month |
2.2 · The instantaneous sensor list
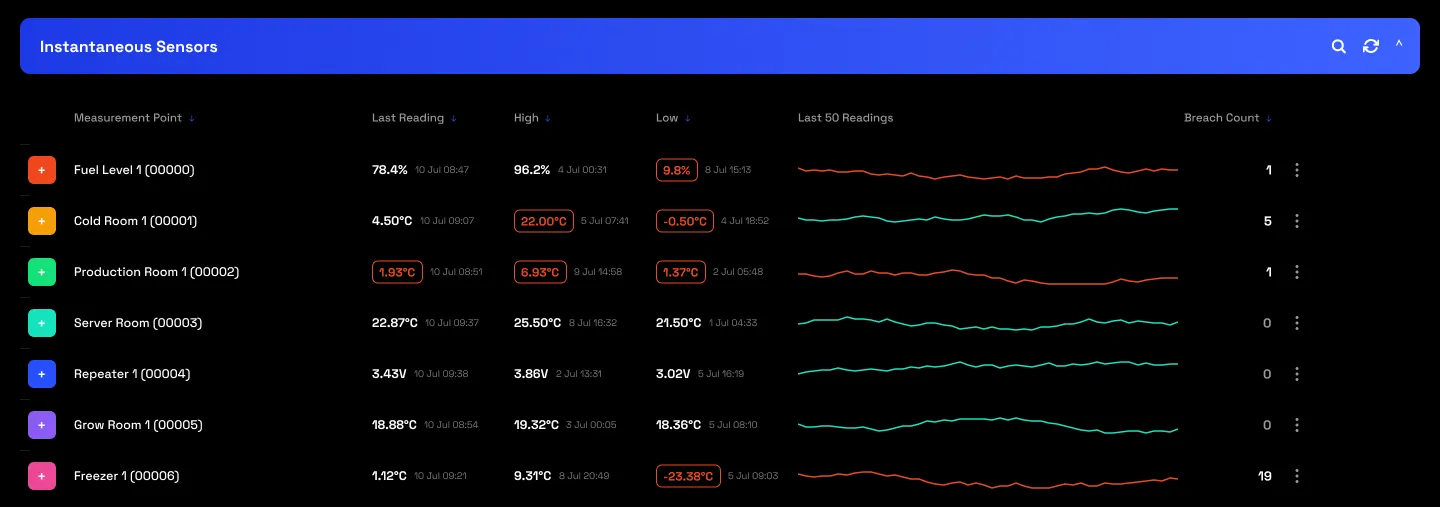
The dashboard lists every instantaneous sensor on the site, one row each, under the Instantaneous Sensors heading. A row reads collapsed by default, and expands for its full detail.
Collapsed row
By default each sensor is a single row summarising how it behaved over the period:
| On the row | What it shows |
|---|---|
| High / Low | The highest and lowest reading in the period |
| Last reading | The most recent value received |
| Last 50 readings | A sparkline of the recent trend |
| Breach count | How many readings fell outside the thresholds |
Expanded view
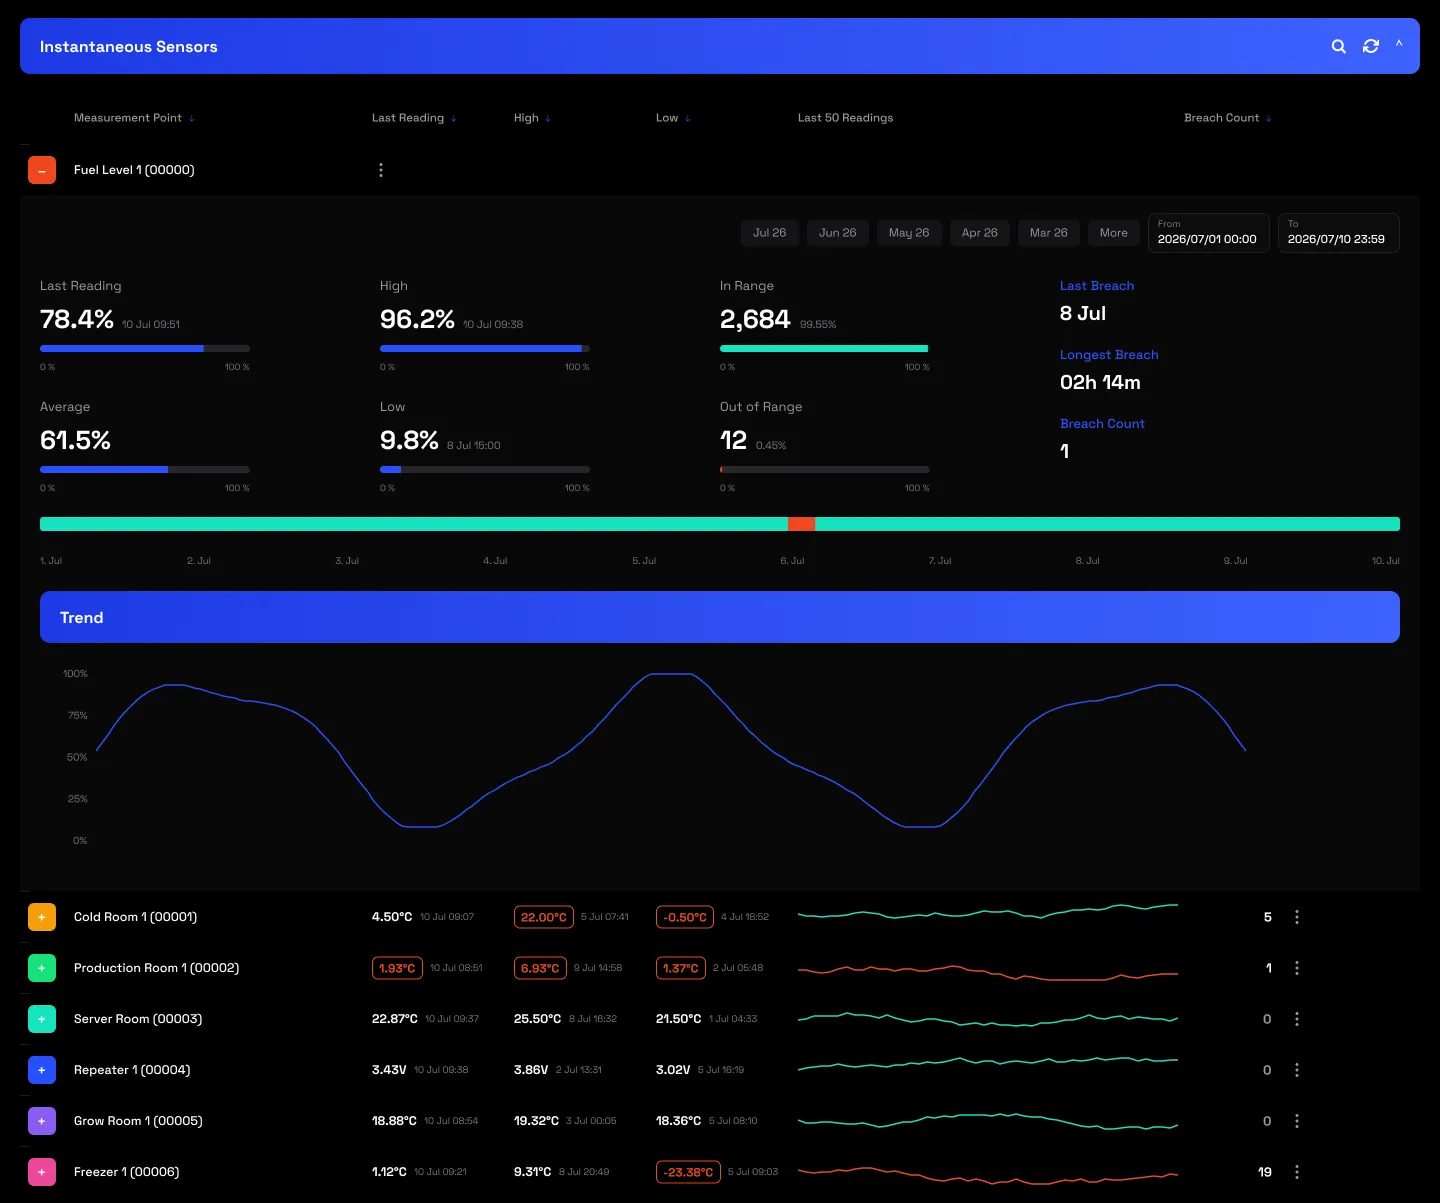
Click the plus on the left of a row to open the full picture: a compliance bar chart, a trend chart, and the top-line readings with threshold bars. The expanded metrics total up the period:
| Metric | What it shows |
|---|---|
| Average | Mean reading over the period |
| In range | Time, and share of the period, within thresholds |
| Out of range | Time, and share of the period, outside thresholds |
| Last breach | Date and time of the last exceedance |
| Longest breach | The longest single out-of-range period |
2.3 · Setpoints and the change log
Thresholds are the basis of every compliance and breach figure, and are set per sensor through the Setpoints menu on its row. Until a sensor has thresholds it shows data but no breach analysis. The Setpoints modal keeps a threshold change log, a timestamped record of every change, for an auditable trail.
2.4 · The sensor menu
Each row has a three-dot menu: View Breach Log lists every breach with its date, time and condition; Triggers jumps to the alert for that sensor; and Setpoints opens the threshold configuration.
3 · Grouping and hierarchy
Sensors are grouped the way you name your site, usually by location, and that grouping follows the same hierarchy used across the platform, so the point selector filters by group and sub-group. Access follows it too: a person sees only the points they have been granted.
4 · Use cases
- The compliance check. Read at a glance which sensors breached and for how long over the period, before anything else.
- Cold-chain sign-off. Show a store held in band for a month, with time-in-range and the breach log, for an auditor or a customer.
- Chase a drift. Expand a breaching sensor to see its trend and when the drift started, then act.
- Set the baseline. Put the right upper and lower limits on a new sensor through Setpoints; the change log records it.
- Watch an area, not a sensor. Group by location and read a whole area’s compliance in one view.
- Prove the record. Pull the breach log and threshold change log as an auditable history.
5 · Exports
- AI-ready (JSON), the readings behind the view as a structured payload a model can read; see AI-ready data.
- CSV & Excel, raw readings at your chosen interval, via Data download.
- API, a live feed of the same readings into your own systems.
6 · Good to know
The dashboard is a trend and compliance view, not a live alarm panel: getting told the moment a limit is crossed is the job of Triggers and alerts. It is not self-configuring either, a sensor without thresholds shows readings but no breach analysis, so setpoints come first. It covers non-electrical telemetry only, and what you see is scoped to your access.
Common questions
What counts as a breach?
A reading outside the configured range for an instantaneous sensor. The dashboard totals these into breach count, time in and out of range, and the longest and last breach.
Why does a sensor show no compliance figures?
It has no thresholds set. Breach and compliance metrics need setpoints; until then you see readings but no analysis.
Can I see a record of threshold changes?
Yes. The Setpoints modal keeps a timestamped threshold change log, an auditable record for compliance.
Does the dashboard send alerts?
No. That is Triggers and alerts. The dashboard is for trend and compliance; triggers do the notifying.
What periods can I view?
A custom date range or a calendar month. There is no billing period here, this is a sensing view, not a utility bill.