The state dashboard.
For sensors that report a state, like open or closed, running or tripped, what is where now, and how long each has held its compliant state.
1 · What it is for
The state dashboard is the view for sensors that report a state rather than a continuous value: a door open or closed, a machine running or stopped, a beam clear or interrupted, a detector safe or triggered. Like its instantaneous counterpart it is a compliance view, and it turns those states into figures: which sensors are in a good state, how long they have held it, how often they changed and when, over the period you choose.
2 · On the page
The sensor-type toggle switches to the state view, which has its own data model and is shown separately from instantaneous sensors. The point selector and date control work the same way.
2.1 · Selectors and indicators
| Control | What it does |
|---|---|
| Sensor-type toggle | Switch the whole view between instantaneous and state sensors, which have different data models and are shown separately |
| Point selector | Filter by group and sub-group, following the way your site is named |
| Date control | Set the period: a custom date range or a calendar month |
2.2 · The state sensor list
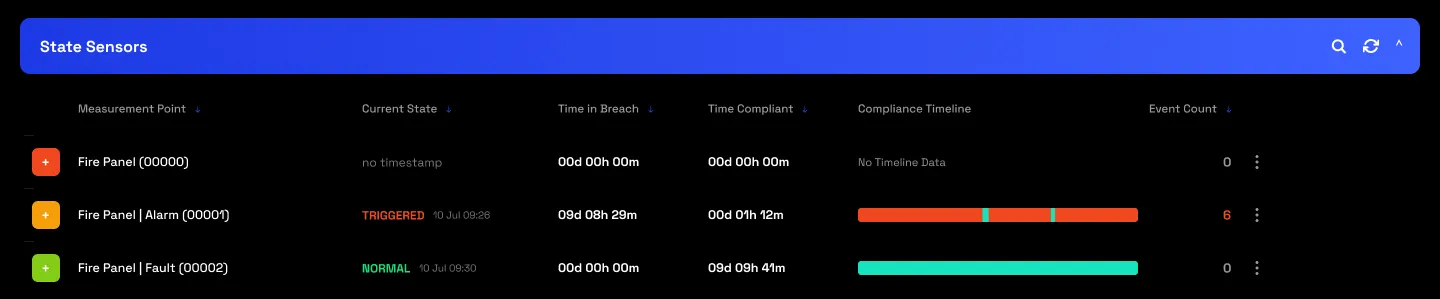
The dashboard lists every state sensor on the site, one row each. A row reads collapsed by default, and expands for its full compliance history.
Collapsed row
Each state sensor is a row summarising the period:
| On the row | What it shows |
|---|---|
| Current state | The last measured state, with the time it changed |
| Time compliant | Total time held in the compliant state |
| Time in breach | Total time in the breach state |
| Event count | Number of state changes in the period |
| Compliance timeline | A bar running green for compliant and red for breach |
Expanded view
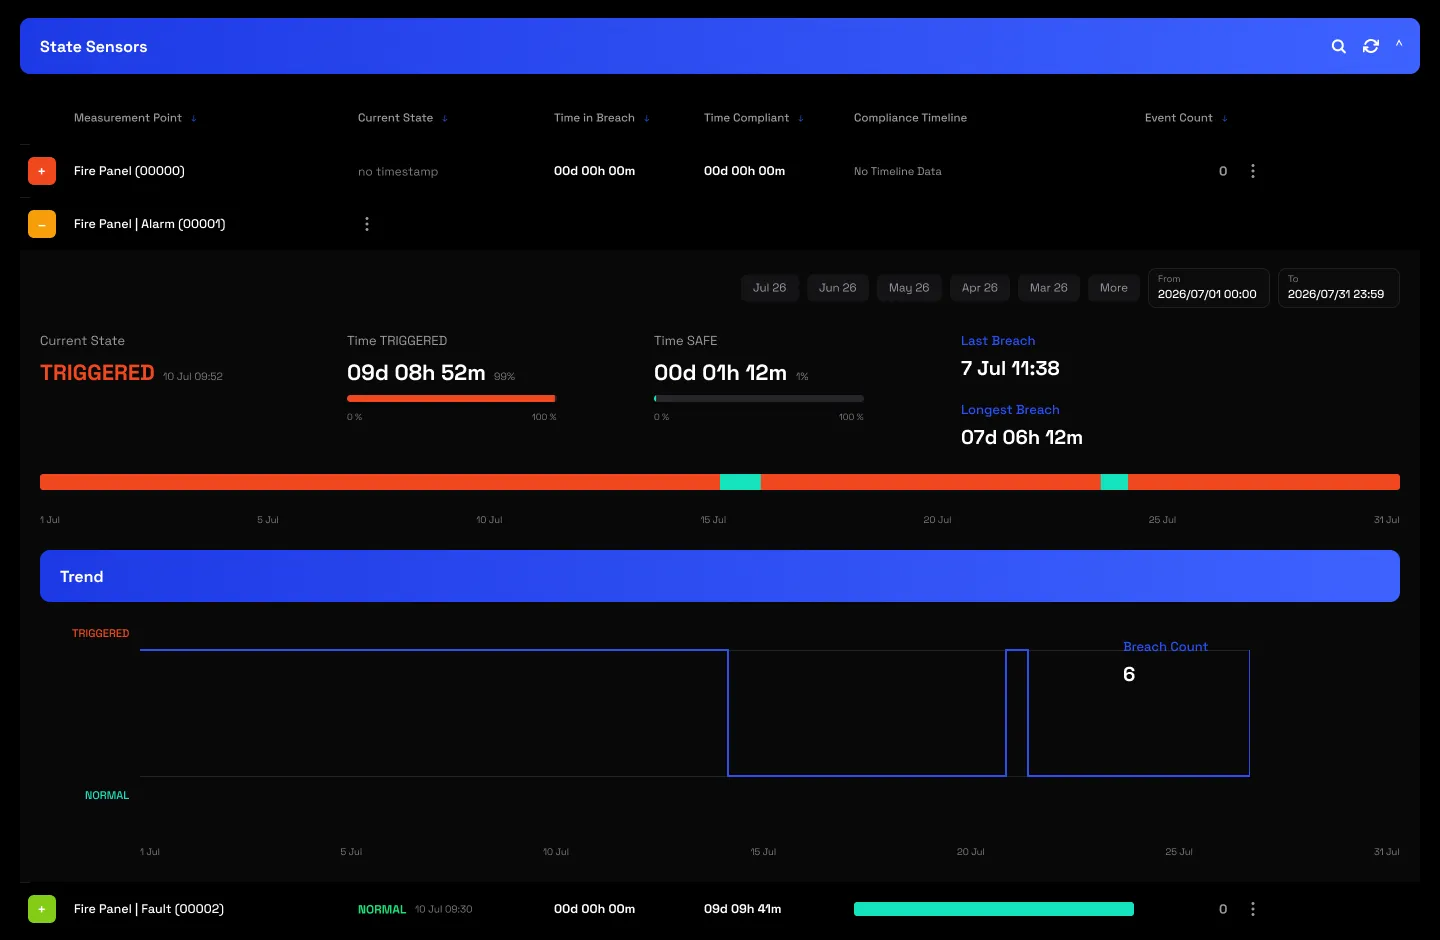
Click the plus to expand a row into its full compliance bar chart and trend, so a run of red, a door left open or a machine that kept tripping, stands out against the green.
2.3 · Compliant and breach states
Instead of an upper and lower limit, a state sensor has a mapping of which states count as compliant and which as breach, set through Setpoints. A cold-room door, for example, maps closed to compliant and open to breach. Every change is an event, logged with its time, and the Setpoints modal keeps a timestamped change log for audit.
2.4 · The sensor menu
Each row’s three-dot menu gives View Breach Log, with every change and its condition, Triggers for the alert on that sensor, and Setpoints for the state mapping.
3 · Grouping and hierarchy
Sensors are grouped the way you name your site, usually by location, following the same hierarchy used across the platform, so the point selector filters by group and sub-group. Access follows it too: a person sees only the points they have been granted.
4 · Use cases
- Catch a door left open. A cold-room or secure door that stays open shows as a red run on the timeline, with the time it opened.
- Watch uptime. Running versus stopped as a state, with time compliant and an event count for how often it changed.
- Access and tamper. Log every time a hatch, gate or tamper switch changes, each with its time.
- Sign off a period. Show time compliant and the event log for an auditor or a customer.
- Read an area. Group by location and take in a whole area’s states in one view.
5 · Exports
- AI-ready (JSON), the state history as a structured payload; see AI-ready data.
- CSV & Excel, the events and durations, via Data download.
- API, a live feed of state changes into your own systems.
6 · Good to know
The state dashboard is a compliance and history view, not a live alarm panel: notifying you the moment a state changes is the job of Triggers and alerts. A sensor needs its compliant and breach states mapped before the compliance figures mean anything, and what you see is scoped to your access.
Common questions
What is a state sensor?
One that reports a discrete state, such as open or closed or running or stopped, rather than a continuous number.
How is compliant decided?
By the state mapping you set in Setpoints, which says which states count as compliant and which as breach.
What is an event?
A change from one state to another, logged with its date and time. The event count is how many happened in the period.
Does it send alerts?
No, that is Triggers and alerts. This view is for compliance and history.