Bill verification
1 · The purpose of this report
Bill verification checks the utility's invoice against what the platform independently works out the bill should be. For each billing period it builds a comparative bill from your measured data, priced on the billing point's tariff from the Augos tariff database, then sets it line by line against the supplier's invoice and shows the variance. Anything beyond a set threshold is flagged before you pay.
Utility invoices are hard to check on their own. Charges get bundled together, some readings are estimated, and there's nothing independent to weigh them against. Bill verification is that independent check, run before you pay, so a real overcharge gets caught while you can still query the invoice instead of chasing a refund months later.
The comparison it leaves behind is a record. A 24-month trend and a period-by-period table give you a documented basis to reconcile from and to dispute from, in place of taking the utility's word for it.
2 · On the page
The page is built around one billing point: a trend of every verification done for it, three action tiles, then the period table and the line-by-line detail behind each row. There's no date selector, each record is bound to the billing period you captured it for.
2.1 · The historic trend chart
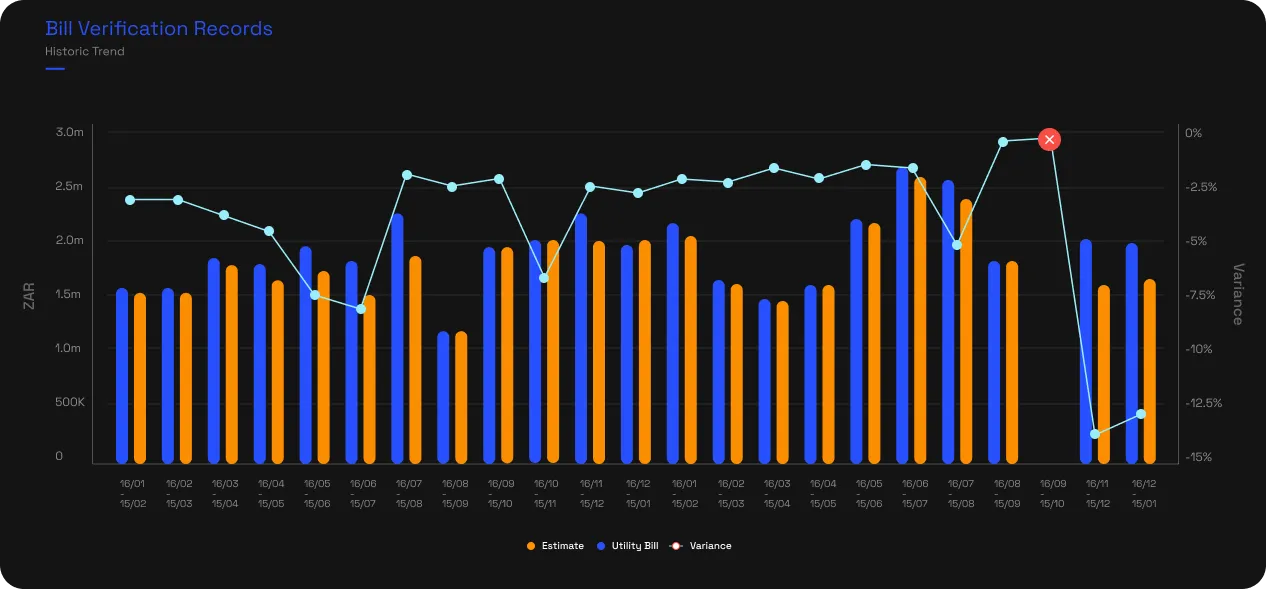
The chart plots every verified period for the point: an orange bar for the platform's estimate, a blue bar for what the utility billed, and a variance line across the top. Where the two bars diverge, the gap is visible at a glance, and a period beyond the threshold is marked on the line.
2.2 · The action tiles
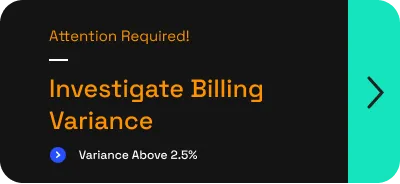
Three tiles sit beside the chart. The first shows whether a billing investigation is warranted, turning to Attention Required when a period runs beyond the threshold, and lets you request one or a call from a consultant. The second opens the tariff loaded to the point, for its details, a comparison against other schemes, or a tariff investigation. The third is where you add a verification for a new period.
2.3 · The report comparison table
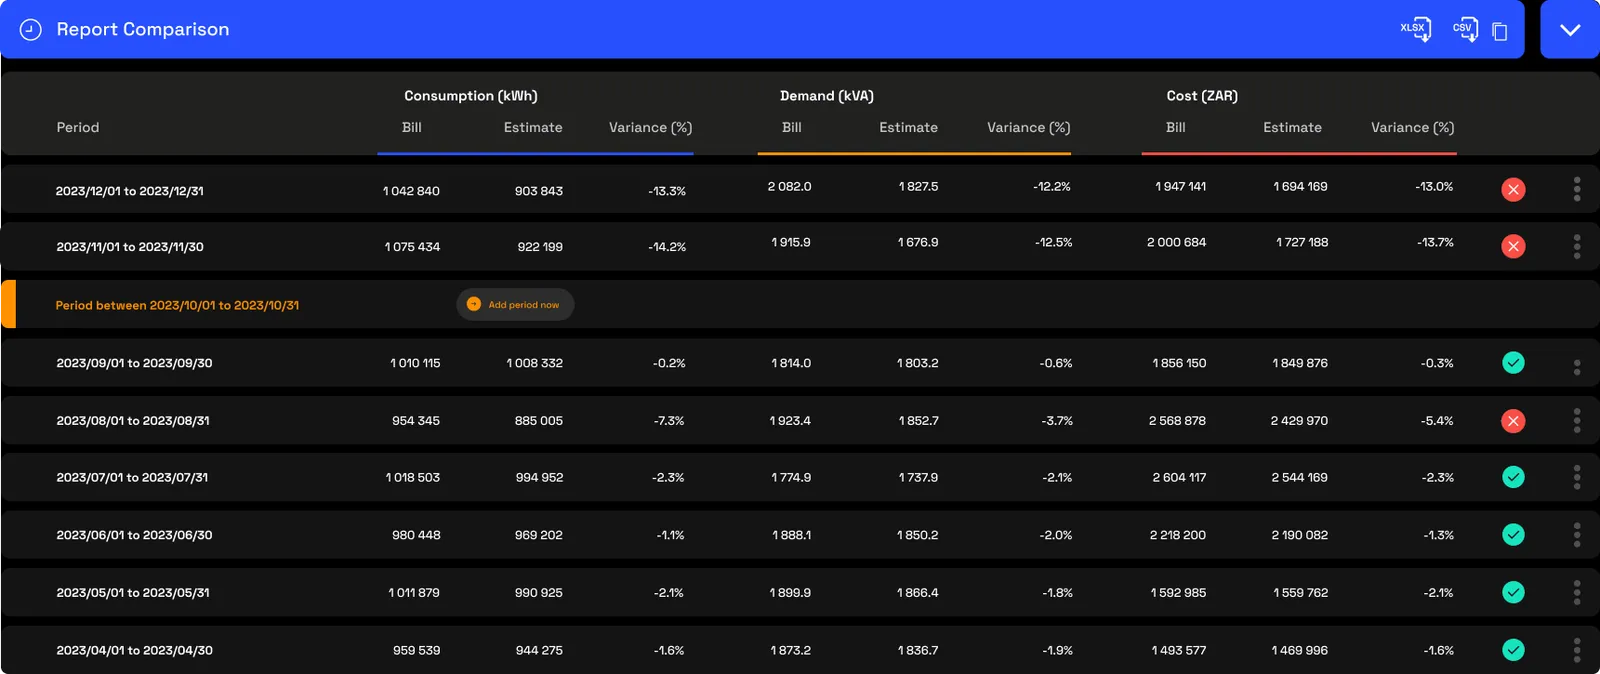
This is the at-a-glance view. One row per period, each split into consumption (kWh), demand (kVA) and cost, and for each of those the bill, the estimate and the variance between them. Run your eye down the status column: a green tick means the period came in within tolerance, a red cross means it's worth a look. The blue bar carries Excel, CSV and Copy table, and each row's three-dot menu opens the full detail behind it. Where a period hasn't been captured yet, an "Add period now" prompt sits in its place, so a gap in the record is hard to miss.
2.4 · The line-by-line detail
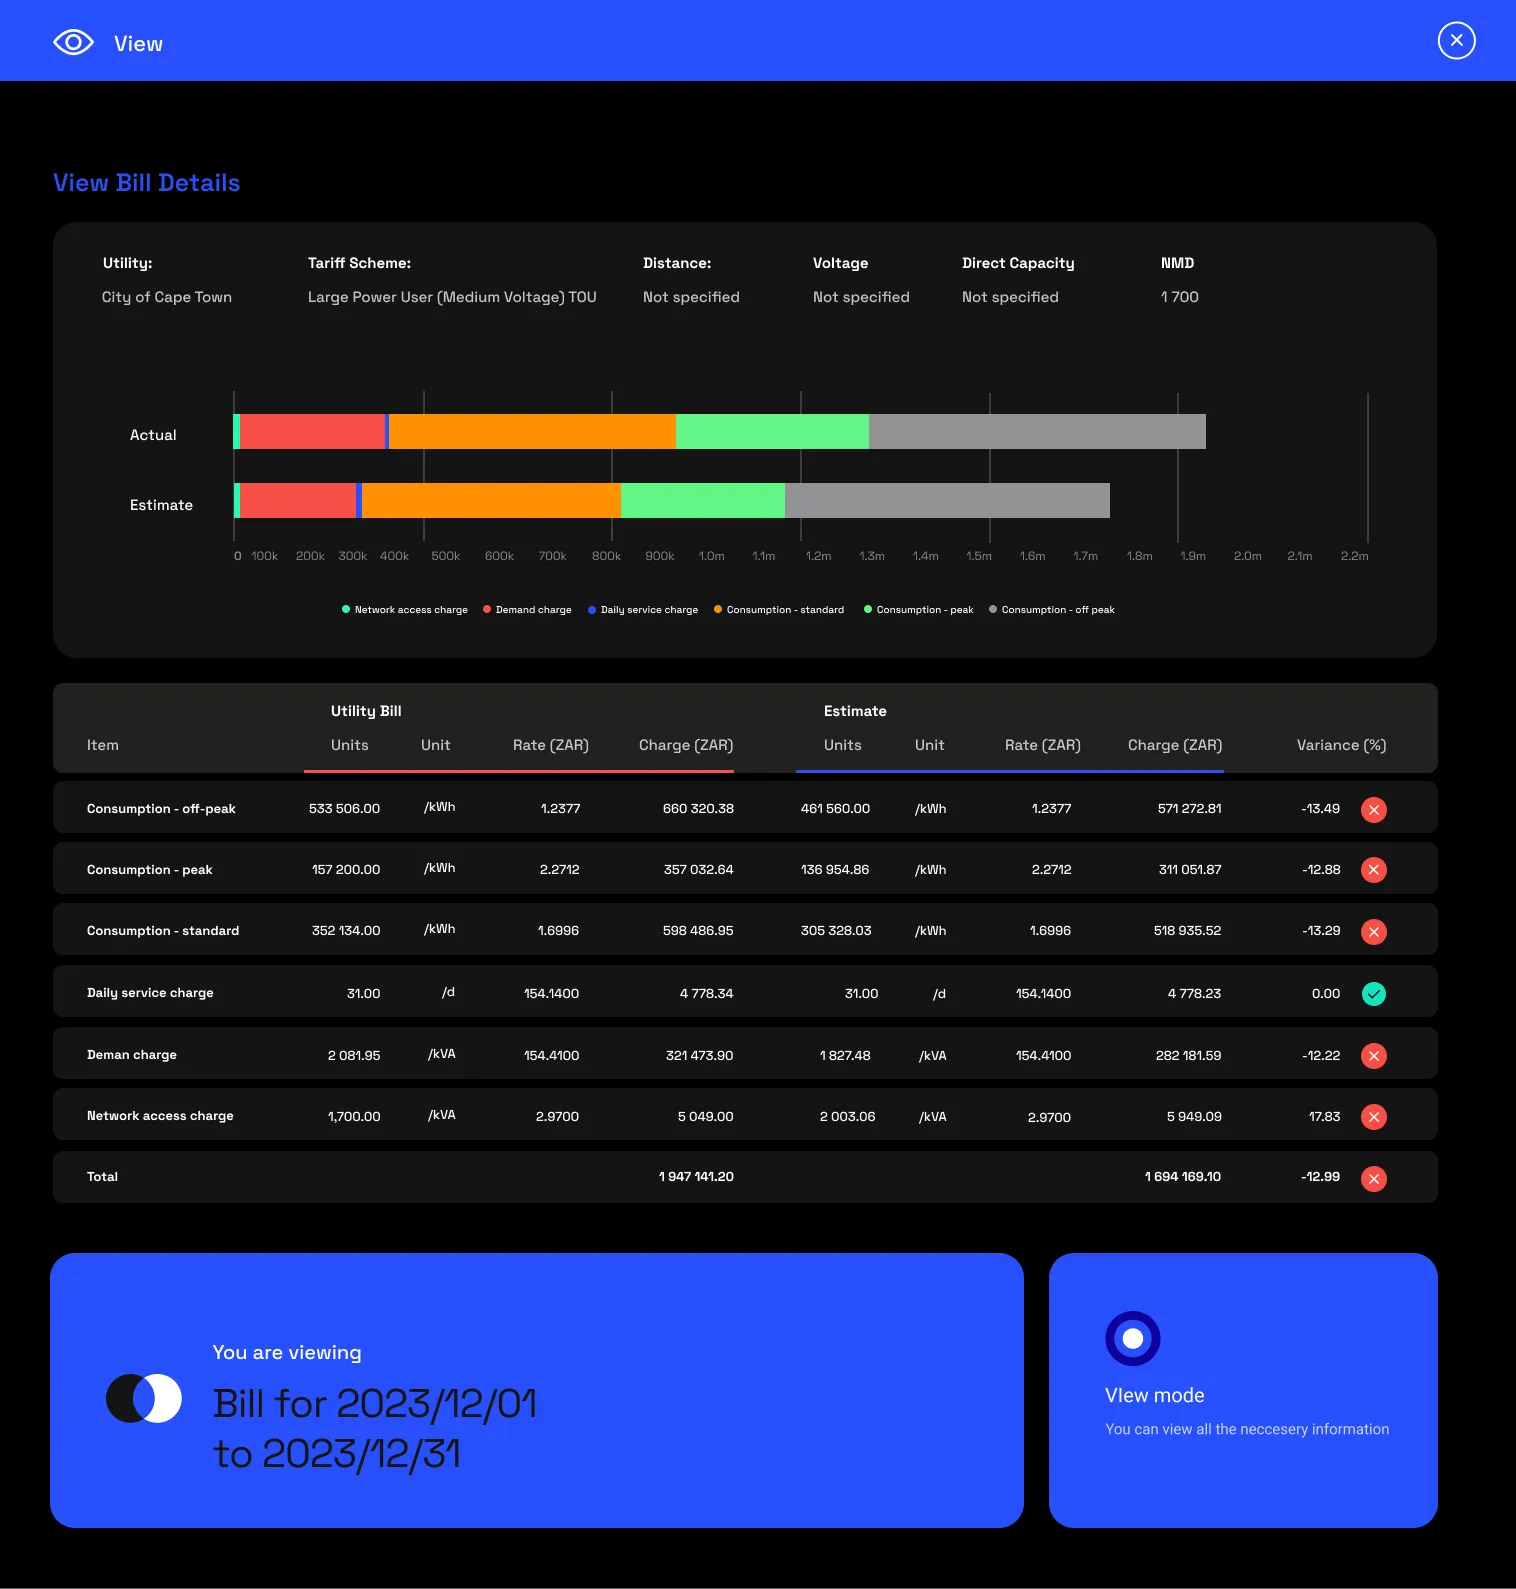
Opening a period's detail puts the bill and the estimate side by side, line item for line item: units, rate and charge on each side, with the variance and a tick or cross per line. This is the view that catches errors that cancel each other out: if the demand line is over and the consumption line is under by a similar amount, the total can look right while both lines are wrong, so it's worth checking line by line, not just the bottom row. The header carries the period's tariff, voltage, capacity and NMD, and the uploaded invoice if one is attached.
3 · Capturing a verification
Capturing a period takes a couple of minutes.
- Open the bill verification page.
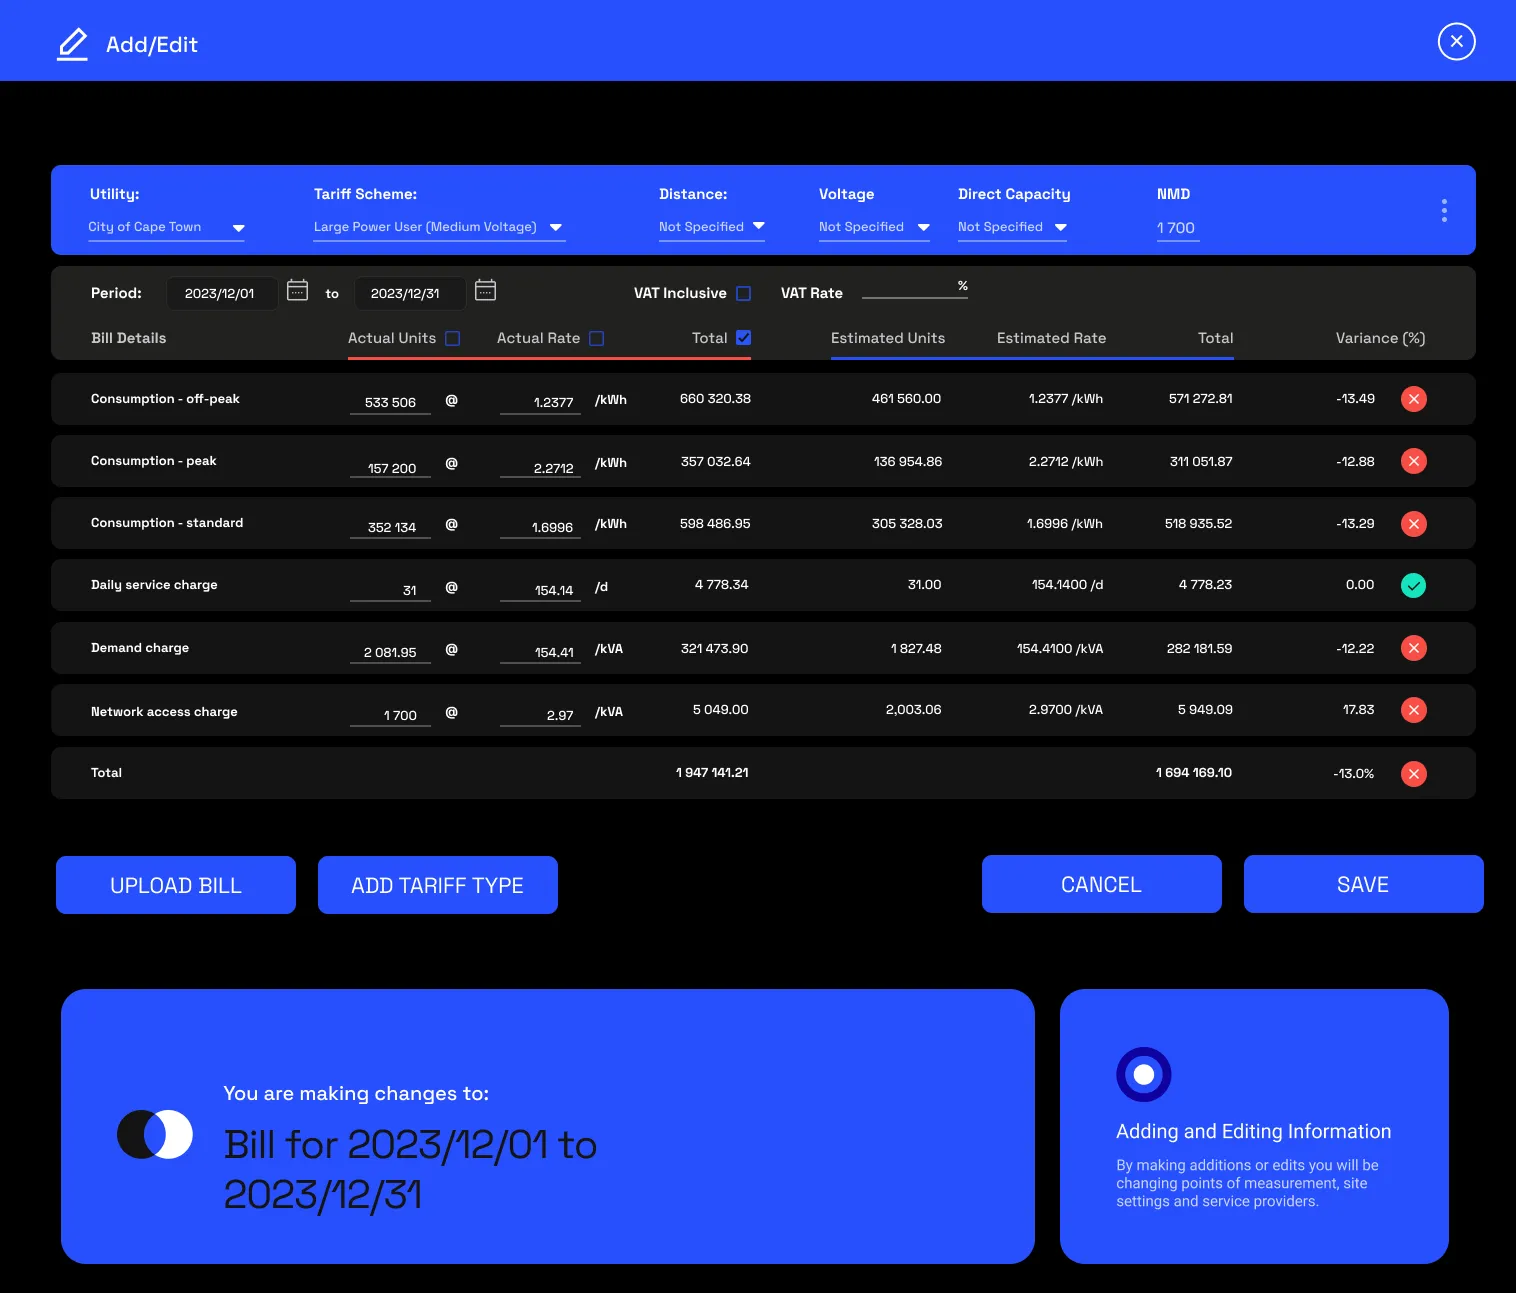
- Click the Add bill verification tile to open the modal for adding a new period.
- Set the from and to dates on the modal to the bill's reading dates, the ones the meter was read between, not the invoice date.
- For each line item on the bill, enter the actual units consumed. The platform already has the rates loaded, so it works out each line's total for you.
- Check the totals. With the right units in and the correct rates loaded, the total in the modal should match the total on the bill. If it doesn't, contact support.
- Check VAT. The figures are exclusive of VAT by default; if your bill is VAT-inclusive, flip the toggle and enter the VAT rate.
4 · Use cases
Every period comes down to one of two findings: you were over-billed, or you were under-billed. Both are worth catching, and in South Africa both can be claimed back for up to 36 months.
- Over-billing, the utility charged more than you owe. The usual causes are the wrong tariff applied, an estimated reading run too high, a rate that wasn't updated, a demand or NMD penalty mischarged, or a metering fault such as an incorrect CT ratio. The variance is flagged before you pay, and the line-by-line comparison is the evidence you dispute and recover with.
- Under-billing, the utility charged less than you used. Usually estimated readings running low, but it can also be a metering fault, an incorrect CT ratio or a similar setup error reading under. Either way a correction is on its way, and the growing gap shows on the trend early, so the back-charge doesn't arrive as a surprise and you can set the money aside for it.
5 · Exports
- AI-ready (JSON). The comparative bill set against the invoice, with each discrepancy and its variance in rand. Feed it to an AI agent to draft a dispute letter that cites the exact kWh gap and the regulatory basis. More on AI-ready data →
- Excel, CSV & Copy table. Both the comparison table and the line-by-line detail, from the icons in their blue bars. More on data download →
6 · Good to know
Variance is the gap between the bill and the estimate, as a percentage. A positive variance means the utility billed less than expected; a negative one means it billed more. Either way, anything beyond ±5% is flagged as an anomaly.
Read the trend, not a single month. One period out of range can be a one-off, but a small variance that repeats is worth investigating even when no single month crosses the line.
This is also where billing periods are created, the same periods the Cost breakdown and Cost allocation reports use.
Only certain roles can capture a verification, and access is scoped by billing point, so a controller can reconcile the master account while a site manager sees only their own.
7 · Common questions
What counts as a meaningful variance?
The flag sits at ±5%. Inside that, a result is marked verified and is usually down to rounding or timing. Beyond it, in either direction, it's flagged as an anomaly worth investigating.
Why flag under-billing, not just over-billing?
Both cost you. In South Africa a claim can be pursued either way for up to 36 months, so an undetected error in either direction can add up to a material amount you could recover.
Can I check a bill based on an estimated reading?
Yes. Your side of the comparison is always actual measured consumption, so it surfaces the gap between the utility's estimate and what was really used.