Consumption breakdown
1 · The purpose of this report
Consumption breakdown maps your site's metering hierarchy: the main incomer at the top, every downstream sub-meter beneath it, each one carrying its own consumption and its share of the total. The parent and child relationships are set up once, at install, and the report draws them as an energy-flow diagram. It works the same way for electricity, water, gas and fuel.
Reading the diagram, you can see at a glance which areas and assets dominate, your Significant Energy Users.
It also shows what isn't measured. A parent meter and the child meters beneath it are read separately, so their totals should match. When they don't, the report flags the difference as an entry of its own. That difference is consumption slipping past your sub-meters, or a metering error worth fixing. Either way, you can now see it and size it instead of guessing.
2 · On the page
Top to bottom: the controls, then the energy-flow diagram, then a bar and donut pair, then the consumption log.
2.1 · Selectors and menu
| Control | What it does |
|---|---|
| Point selector | Choose any point you have access to. The hierarchy is drawn from that point down. |
| Date selector | Custom range, calendar month, billing period, 24 months, or by shift. Changing it recalculates every point's consumption and share. |
| Product selector | Switch utility: electricity, water, fuel or gas. Each has its own hierarchy. |
| Three-dot menu | Open the data-download window, or download a Consumption breakdown PDF for the point and period. |
2.2 · The energy-flow diagram
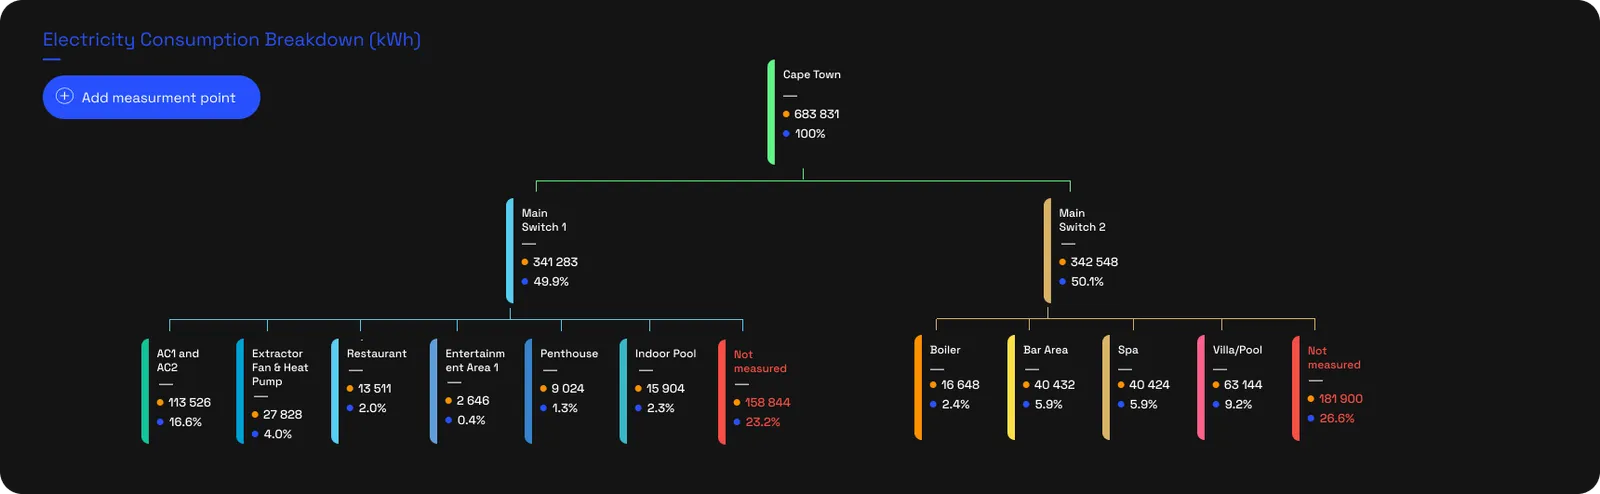
This is the heart of the report: a diagram of your installed measurement, drawn from the point you've selected downwards. Each box in the diagram is a measurement point, shown against its parent, its siblings and its children. Every point carries its consumption (kWh, kl or m³) and the percentage it contributes to the total. Click a point to focus the bar and donut charts below on it.
Where the sub-points under a parent don't add up to it, the report adds a virtual measurement point for the difference: Not Measured when the children total less than the parent, Over Measured when they total more. Both are drawn in red, every time you open the report, until the gap is closed.
2.3 · Bar and donut charts
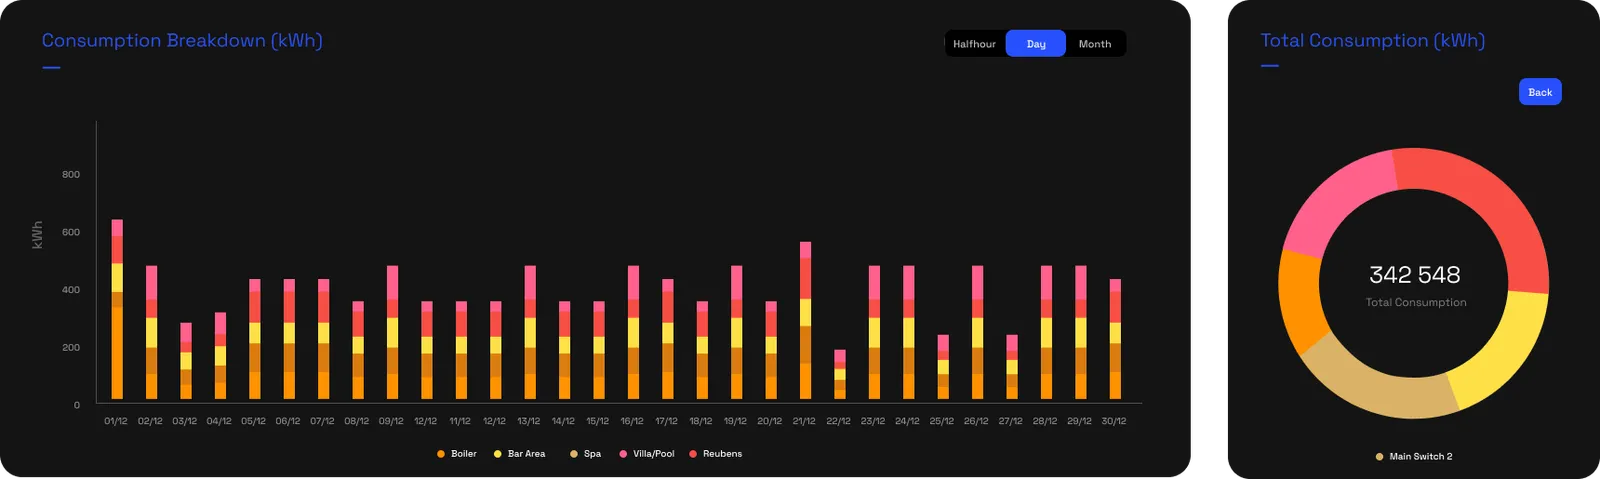
Below the diagram, a bar chart and a donut work together for the selected point and period. The bar chart stacks each sub-point's consumption at half-hour, day or month intervals, so you can see both the total shape and who makes it up over time. The donut shows each sub-point's share of the period total, and where sub-metering exists you can drill into a point to break it down further.
2.4 · The consumption log
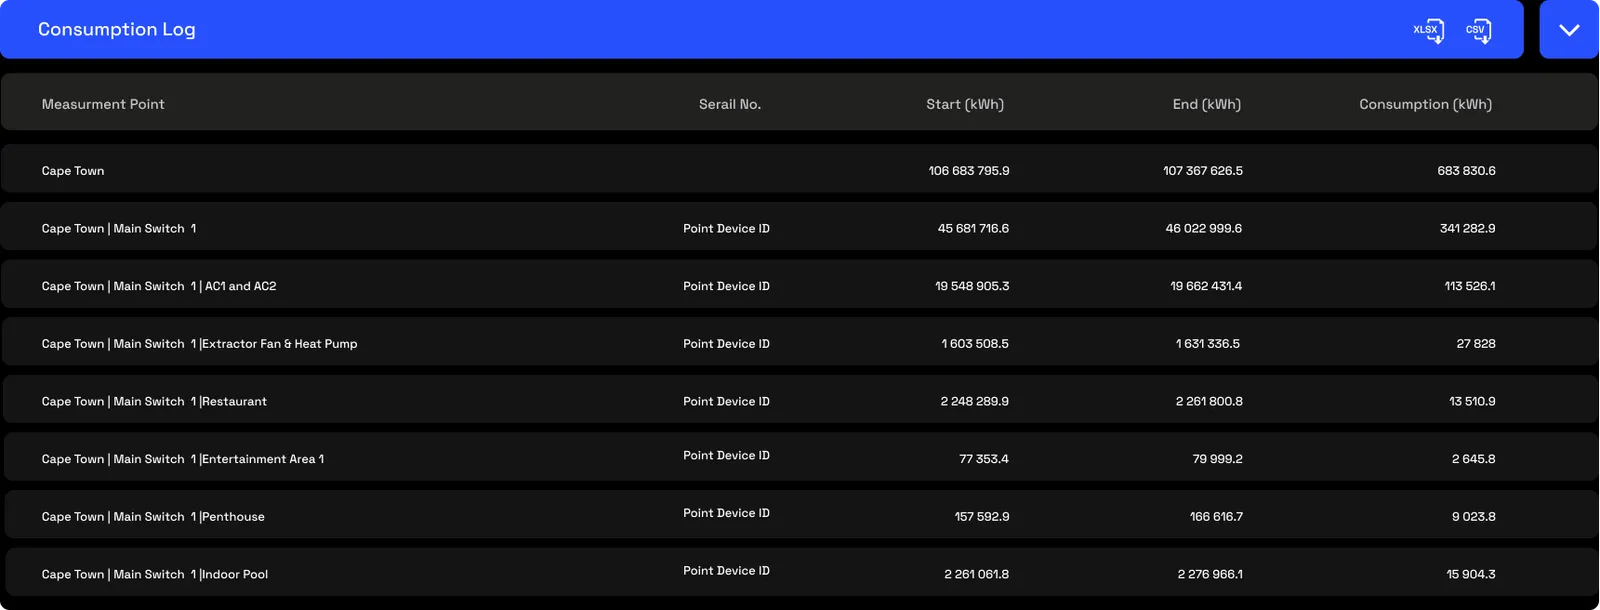
The consumption log is a plain table of every measurement point: its name, serial number, the reading at the start and end of the period, and the total consumption between them. It exports to Excel or CSV straight from the blue bar.
3 · Use cases
- Find unaccounted consumption. A Not Measured point under a parent tells the maintenance team exactly where in the hierarchy to look, instead of searching the whole network blind.
- Identify Significant Energy Users. Each point's share of the total is on the diagram, so you can read off the assets that cross your SEU threshold for an ISO 50001 audit without exporting anything.
- Verify multi-tenant metering. Confirm every tenant's consumption is measured and rolls up to the right billing point; any gap between the incomer and the sum of sub-meters surfaces before it reaches billing.
- Justify capital spend. Show that, say, the chiller plant is 40% of site load straight from its share on the diagram, and the case for upgrading it becomes defensible.
4 · Exports
- AI-ready (JSON). The flattened hierarchy with each point's consumption, share and Not Measured flag, plus embedded guidance for an AI agent to reconstruct the hierarchy. Feed it the hierarchy and ask which blind spots cost the most. More on AI-ready data →
- PDF. A Consumption breakdown for the point and period, from the three-dot menu.
- Excel & CSV. The consumption log, from the blue bar above the table, or any data via the download window. More on data download →
5 · Good to know
The hierarchy is configured once, at install, when each meter is assigned its parent and children; there's no ongoing setup as you use the report. Access is scoped by point, so people see only the parts of the hierarchy they're cleared for. And it isn't a billing tool: it shows proportional shares rather than invoices. For tenant invoices, use Tenant billing, which applies the right tariff to each tenant's own meter.
6 · Common questions
Why is the “Not Measured” figure so large?
It's a measured gap, not an error. Energy is coming in through a parent meter that no downstream sub-meter is accounting for. The usual causes are a sub-meter that has lost connectivity, an asset installed without metering, or simply incomplete coverage on that branch.
Why did a sub-meter's percentage change when I changed the dates?
Each share is worked out against the parent's total over the window you choose. Switch from a weekday to a weekend and the parent total changes, so the slice changes with it.
Can I use this to bill tenants?
No. Consumption breakdown shows proportional shares across the hierarchy; it isn't a billing tool. Tenant billing applies the actual tariff to each tenant's measured consumption, which is a separate, dedicated job.