Data download
1 · The purpose of this report
Data download is how you get the raw telemetry out. Where the other reports give you a processed view, this gives you the underlying measurements themselves, at the interval and period you choose, ready to take into your own tools. It doesn't interpret or chart anything; its one job is to get the data out cleanly.
2 · On the page
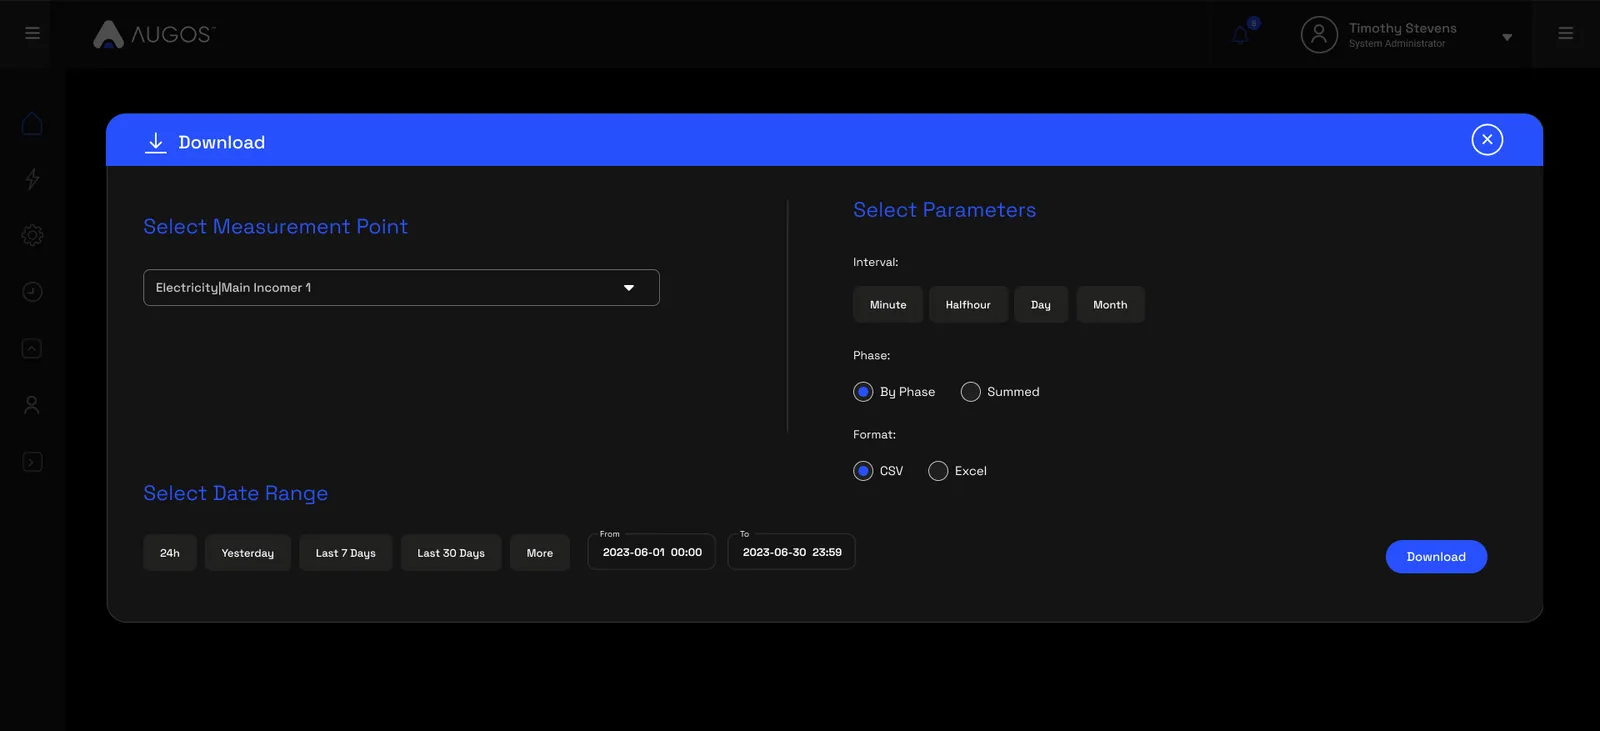
There's just the one modal: pick a point, set the parameters and format, choose a window, and download.
2.1 · The download modal
| Control | What it does |
|---|---|
| Measurement point | Choose any point you have access to. |
| Interval | Minute, half-hour, day or month. |
| Phase | By phase returns L1, L2 and L3 as separate columns; Summed returns the system total. |
| Format | CSV or Excel. |
| Date range | A custom range, calendar month, billing period, 24 months, or by shift. |
2.2 · What you can export
What you can pull depends on what the site's hardware actually measures, across four families: electrical (voltage, current, active and apparent power, frequency, demand), environmental (temperature, humidity, irradiance, rainfall, wind), mechanical (volume, flow, pressure) and logic states (machine status, switch and relay positions). If a sensor isn't fitted, its parameter simply won't be there.
3 · Use cases
- Supply audit evidence. Export exactly the parameters, period and shifts an ESG or compliance report needs, straight into the reporting workflow.
- Build your own model. Pull several parameter families, say temperature, irradiance and demand, time-aligned in one file, ready for a regression in your own environment.
- Investigate phase imbalance. Set By phase and pull L1, L2 and L3 currents at one-minute resolution to see which phase runs high.
- Build your own reports. Pull the data into Excel, a BI tool or your data lake and build the custom reports and dashboards the fixed reports don't cover, with no proprietary lock-in on the way out.
4 · Exports
- CSV & Excel. The raw, ISO-8601 timestamped telemetry, for any point and parameters.
- AI-ready (JSON). The same arrays for machine ingestion. Feed raw kWh to an AI agent with a grid emission factor and get Scope 2 carbon by month. More on AI-ready data →
- API. The same export is scriptable, so you can schedule or automate it. More on the API →
5 · Good to know
One-minute resolution is subject to the meter's polling rate, and a single export is capped at around a million rows to keep a broad query from straining the database, so narrow the window or widen the interval for a long pull.
By phase is for power-quality and imbalance work; Summed is for capacity planning and cost reconciliation. The same data is available through the API for scheduled or automated extraction. Access is scoped by point.
6 · Common questions
How granular can the export be?
Down to one-minute resolution, depending on what the meter at that point polls.
What's the difference between By Phase and Summed?
By Phase gives you L1, L2 and L3 as separate columns, which you need for phase-imbalance and power-quality work. Summed gives the totalled system figure, for high-level reporting and cost reconciliation.
Can I get non-electrical data like flow or temperature?
Only what's physically measured at the site. If sensors for flow, pressure or temperature are installed, those parameters appear. There's no external data feed; the export is limited to what the hardware measures.
Can I automate the export?
Yes, through the API. Anything available in the download screen can be pulled programmatically on a schedule, with no manual step.