Cost breakdown
1 · The purpose of this report
Cost breakdown takes the utility bill apart, showing every charge on your tariff with its rate, its total and its share of the bill. It works by applying the tariff configured for the billing point to your measured consumption, so the result is the same calculation the municipality runs, against your own data.
When a bill goes up, the cause can be higher consumption, a demand charge, a fixed fee or a rate change, and each calls for a different response. Cost breakdown shows which line items moved, so you can act on the right one.
It runs at the billing point and at every sub-meter beneath it, so each area, asset or tenant carries a cost in the same terms as the top-level bill. That puts a rand figure on the Significant Energy Users you find in Consumption breakdown.
2 · On the page
Top to bottom: the controls, then the billing-point cost table, then the same breakdown per sub-meter, then the long-range history.
2.1 · Selectors and menu
| Control | What it does |
|---|---|
| Point selector | Choose any billing point you have access to. |
| Date selector | A full calendar month, or a billing period that matches your utility account. Billing periods are created on the Bill verification page and then appear here. |
| Product selector | Switch utility: electricity, water, fuel or gas. |
| Three-dot menu | Open the data-download window, or download a Cost breakdown PDF for the point and period. |
2.2 · The cost breakdown table
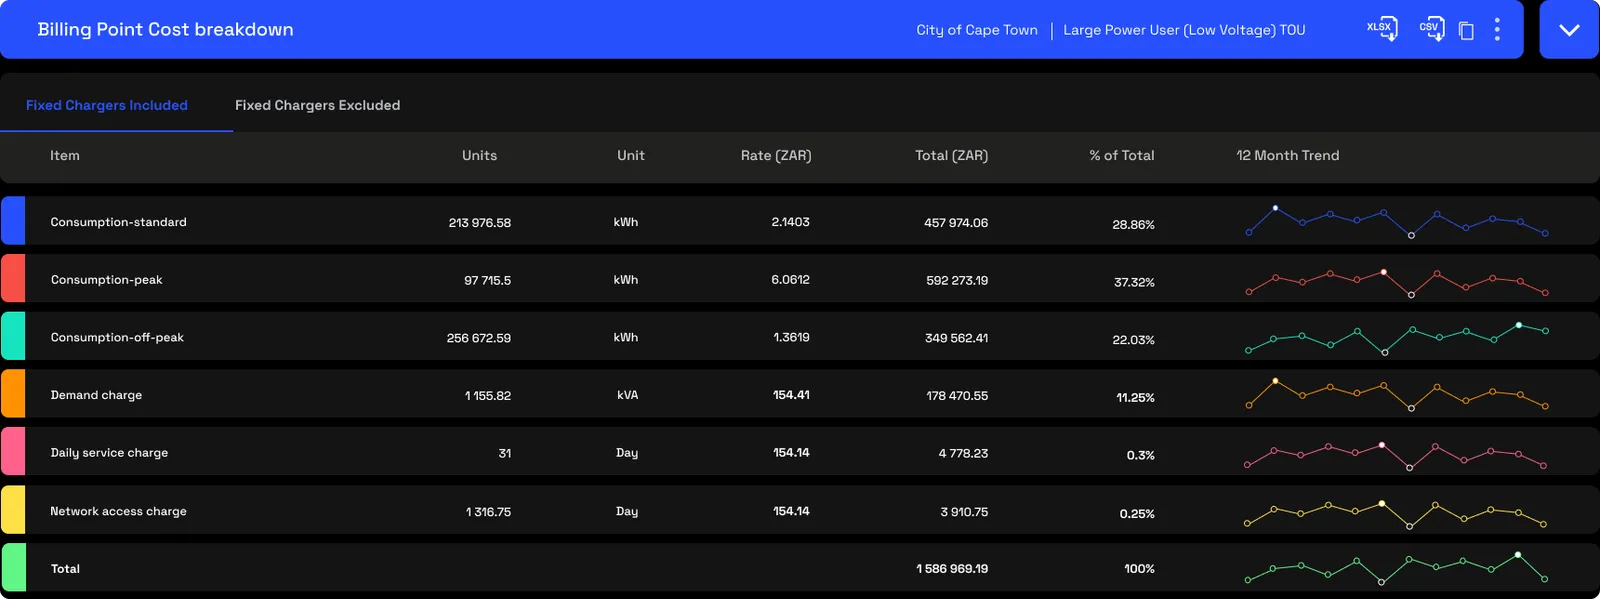
The section opens with a summary bar: the whole bill as one stacked strip, each charge type a coloured segment sized by its share, which you can hover to read the exact percentage. It gives you the bill's composition at a glance before the detail below.

Below it, the main table lists every line item on your tariff. For each one it shows the measured units and their unit of measure, the rate charged per unit, the total (units times rate), that line's share of the bill, and a 12-month sparkline of how it has moved. A Total row closes it off. The blue bar above the table names the tariff loaded to the point and carries the export icons: Excel, CSV and Copy table.
Two tabs sit at the top of the table: Fixed charges included and Fixed charges excluded. Excluding drops the fixed charges only, the standing fees you pay regardless of use, such as the daily or monthly service charge. Every variable charge stays, both consumption and demand. That leaves the part of the bill that moves with how and when you run, which is what you want in view when you're weighing an operational change.
2.3 · Sub-measurement cost breakdown
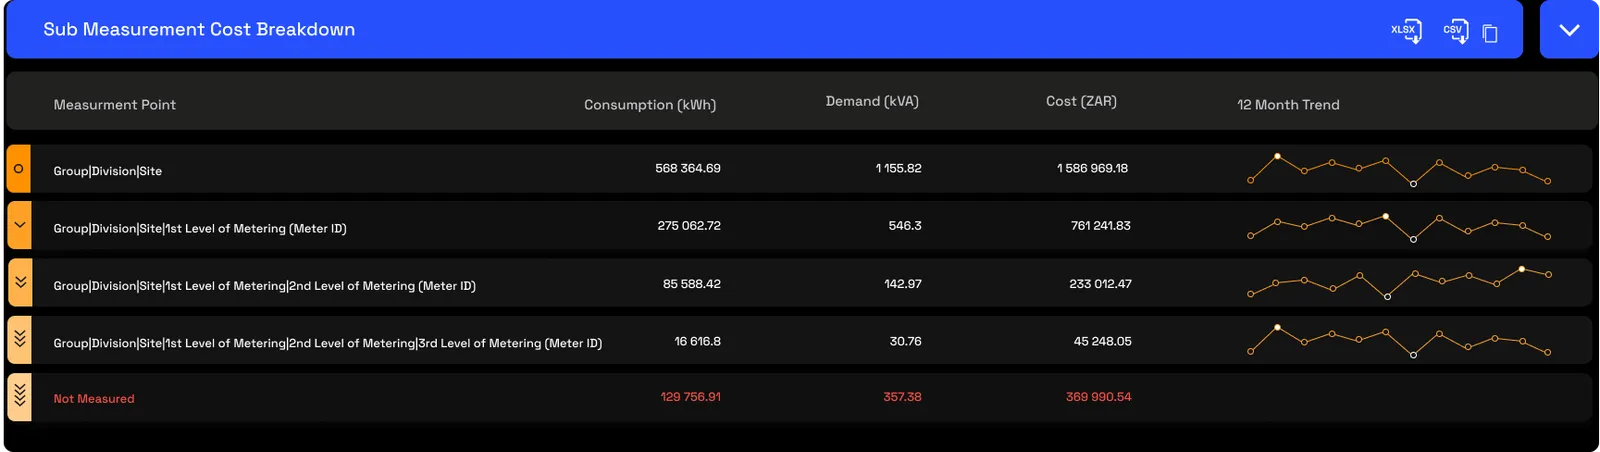
Below the bill, the same costing runs down the metering hierarchy. Each sub-meter gets a row with its consumption (kWh), demand (kVA), cost and a 12-month sparkline, and expands to the full line-item breakdown for that point. Where the sub-meters don't add up to the parent, the difference appears as a Not Measured row, costed like any other, so unaccounted consumption carries a rand figure too.
2.4 · Historic data
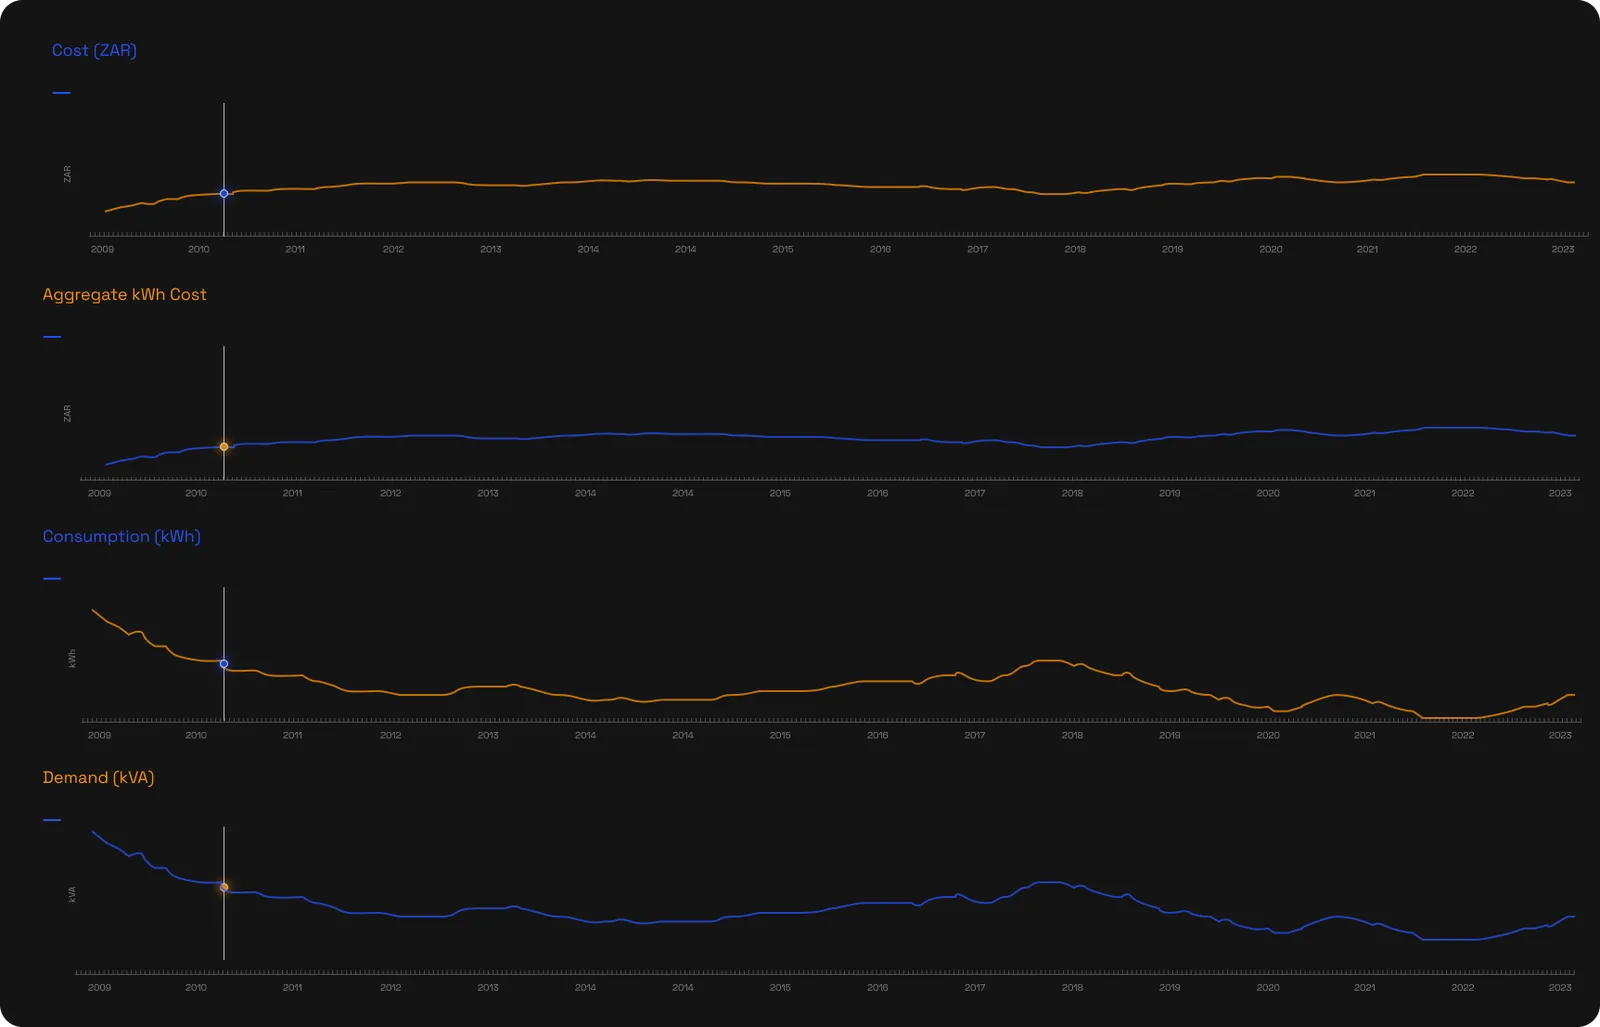
At the foot of the page, a stack of charts plots the headline metrics month by month over the long run: total cost, aggregate cost per kWh, consumption and demand. Read together, they separate a tariff escalation from a seasonal swing from a real change in how much you use.
3 · Use cases
- See the bill before it arrives. The total builds through the period, broken into charge types, so finance can see where it's heading rather than waiting for the invoice.
- Find what's driving an increase. The % of Total column shows whether a rise is in consumption, demand or fixed charges, which points to the right response.
- Cost each area or tenant. The sub-meter view gives a financial basis for internal cost allocation. For complex or custom rules, use the Cost allocation module.
- Report energy spend for ESG. The line-item financial data, split by charge type, is what sustainability teams need to attach cost to energy use for Scope 2 disclosures.
- Explain bill movements. The 12-month sparklines separate tariff escalations, seasonal shifts and consumption-driven changes, with the history to back it up.
4 · Exports
- AI-ready (JSON). A fully costed ledger: every line item with its units, rate and total. Feed this period and the same period last year to an AI agent and ask it to attribute a bill increase to consumption, a rate change or a demand spike. More on AI-ready data →
- PDF. A Cost breakdown for the point and period, from the three-dot menu.
- Excel, CSV & Copy table. The table data, from the icons in the blue bar, or any data via the download window. More on data download →
5 · Good to know
Cost breakdown is calculated against the tariff configured for the point, not the municipality's invoice. To check the platform's figures against the actual bill, line by line, use Bill verification, which is also where billing periods are created. Access is scoped to the billing points you've been granted. And for cost allocation beyond a straight per-meter split, with custom or shared rules, the Cost allocation module is the right tool.
6 · Common questions
Does cost breakdown match my actual municipal bill?
It's calculated against the tariff configured for the billing point, so it runs the same calculation the municipality does, on your measured data. To reconcile it line by line against the actual invoice, use Bill verification.
What does the % of Total column tell me?
Each charge as a share of the period's bill. It's how you see the bill's composition shift over time, for instance whether demand charges are growing as a proportion independent of how much you used. The cost column stays the reference for budgeting.
What happens when I exclude fixed charges?
It removes the standing daily and capacity fees and leaves only the variable, consumption-linked cost. That's the right view when you're modelling a demand-side change and want to see what's actually movable.