Technical analysis
1 · The purpose of this report
Technical analysis charts the electrical readings for any measurement point over time. Pick a point and it opens that point and every sub-point beneath it in the hierarchy, each as its own expandable chart, at a resolution down to one minute.
It's for investigation: an engineer opens it to see what a circuit was doing at a specific moment, the kind of detail a daily summary smooths away. You set the window with the date selector, and read demand, power, power factor and the reactive components straight off the chart. There's no cost data here, just the electrical measurements.
2 · On the page
Pick a point and a window: a table of every measurement point, each row expandable to its charts and a statistics breakdown.
2.1 · Selectors and menu
| Control | What it does |
|---|---|
| Point selector | Any point. From the site level you can reach every sub-meter beneath it. |
| Date selector | Custom range, calendar month, billing period, 24 months, shifts, or a single day. |
| Product selector | Switch utility: electricity, water, fuel or gas. |
| Three-dot menu | Open the data-download window. |
2.2 · The measurement-point table
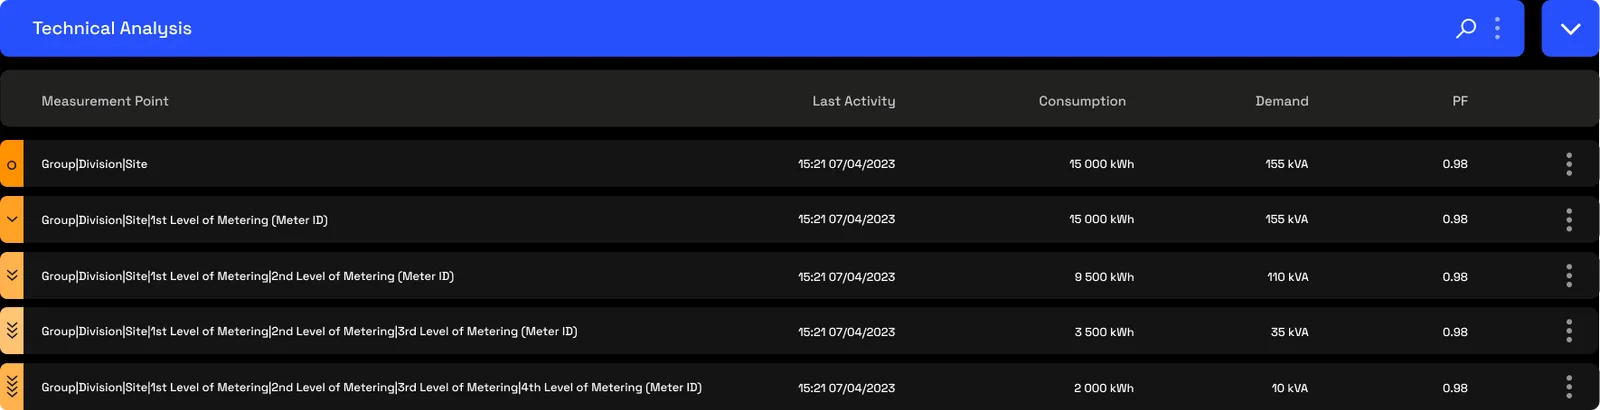
The page opens as a table of every measurement point that has Augos metering, in hierarchy order, with an indicator on the left showing how far down the hierarchy each one sits. Each row carries its last activity, consumption, demand (kVA) and power factor, a quick read before you open it up.
2.3 · The per-point charts
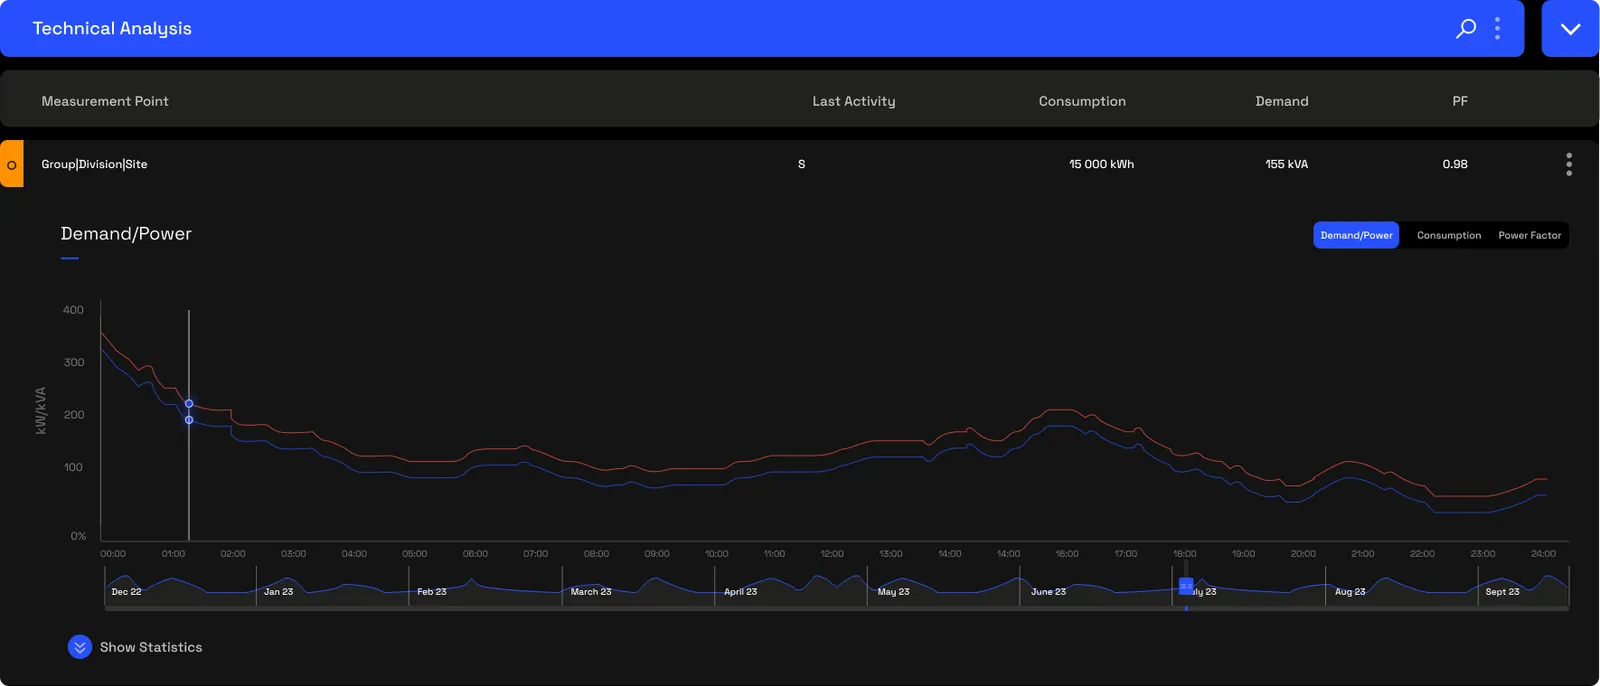
Click the level indicator on the left of a row and it expands to a chart for that point. Three tabs switch the view: Demand/Power overlays power (kW) and demand (kVA) on one axis, Consumption draws as bars, and Power factor as a line. On a single day the charts plot down to one-minute intervals, and a strip along the bottom lets you scrub across the measured history.
2.4 · Show statistics
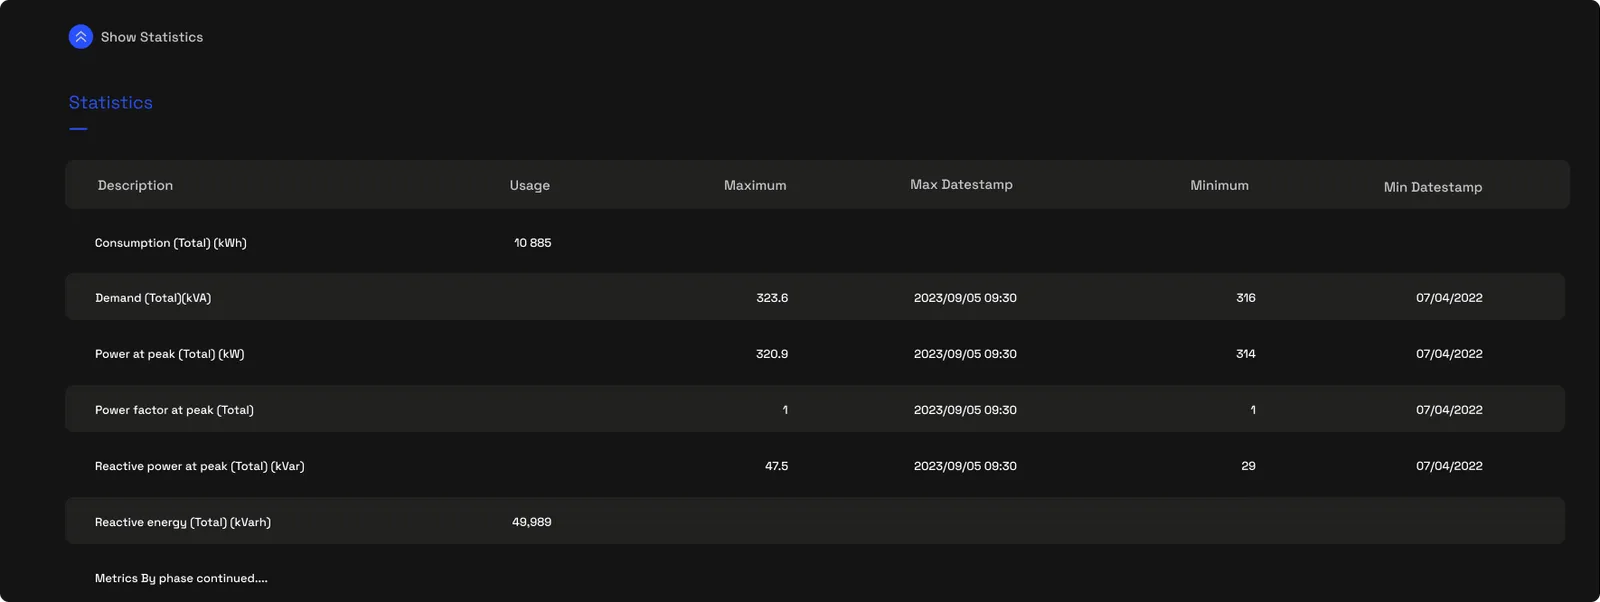
Below the chart, Show statistics opens a table of the numbers behind it: for the window and point you're on, the maximum and minimum of each metric, with the timestamp each one occurred, broken down by phase. It covers consumption, demand, power at peak, power factor, and the reactive power and energy, so once a pattern shows in the trace you can read the exact figures off it.
3 · Use cases
- Diagnose an unexplained peak. Open the day at one-minute resolution and the Demand/Power trace shows exactly when the spike hit and how kW and kVA moved, detail a daily figure hides.
- Investigate power factor on a circuit. Plot a sub-meter's power factor across a fortnight and a recurring dip will line up with a time pattern, pointing to the cause.
- Check an asset's consumption. Open the point on the Consumption tab and the trace shows whether the load is steady, intermittent, or tied to a particular period.
- Find a phase imbalance. The per-phase voltage and current in the export let you, or an AI agent, flag where one phase runs consistently higher than the others.
4 · Exports
- AI-ready (JSON). The high-frequency time-series, down to per-phase voltage and current. Hand a period to an AI agent and ask it to find where phase imbalance exceeds a threshold, and when. More on AI-ready data →
- Excel & CSV. The point's data, via the download window. More on data download →
5 · Good to know
There's no look-back limit: every measured interval is kept, and on a single day the charts go down to one-minute detail, fine enough to catch a momentary event.
Technical analysis works at the sub-meter, for diagnosis. When the question turns to what poor power factor is costing and how to correct it, that's Power factor and demand; when you want to overlay unrelated points, or a reading against something like temperature, that's Charting.
Access is scoped by point, so you can only plot the measurement points you're cleared to see.
6 · Common questions
When should I use this instead of the dashboard?
The Dashboard gives you the day's aggregated picture. Technical analysis is for investigating a specific point at higher resolution: what happened on this circuit at this time.
What's the difference between demand (kVA) and power (kW)?
kW is the real power doing useful work; kVA is the apparent power, including the reactive part. Their ratio is power factor, and a site billed on kVA pays for both, which is why reactive behaviour matters even at sub-meter level.
How far back can I look?
All of your measured history is available through the time controls. There's no fixed look-back limit.
Can I view more than one point at once?
Yes. Selecting a point expands to show it and every sub-point below it, each with its own chart. For overlaying unrelated points side by side, Charting is the better tool.